Macquarie Group — Personal Banking Dashboard

Product design, Research, Design systems

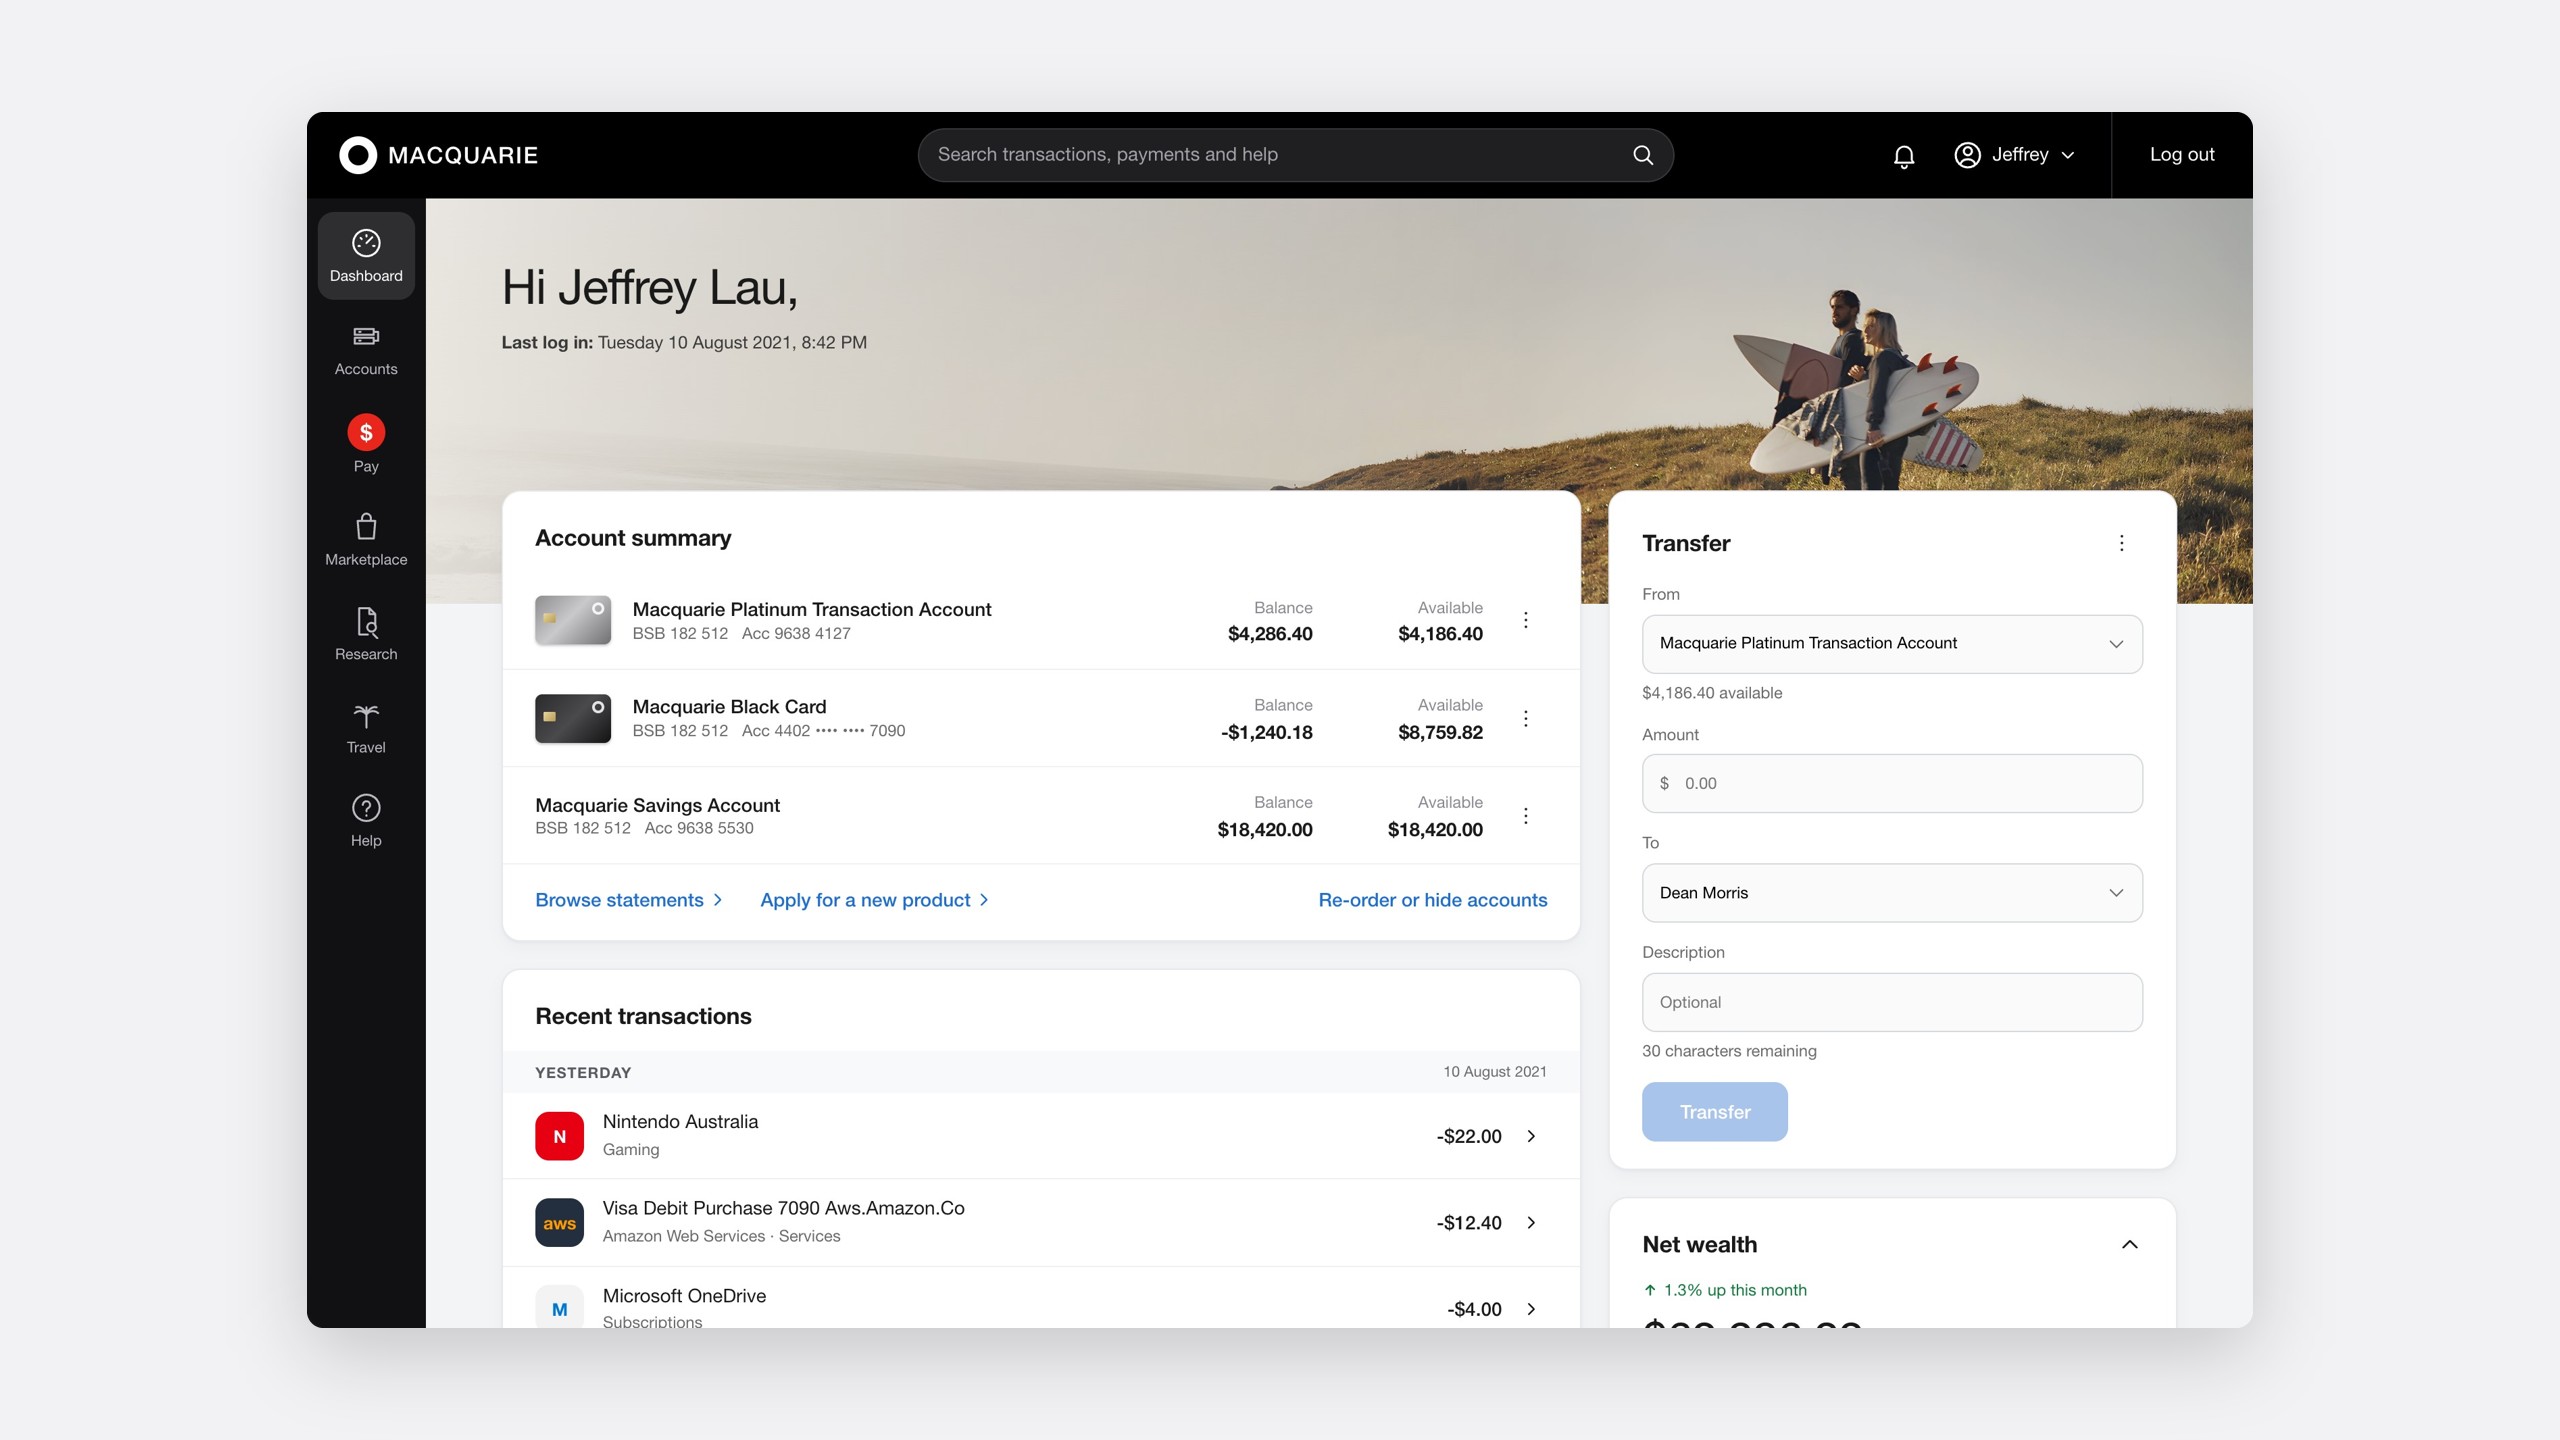
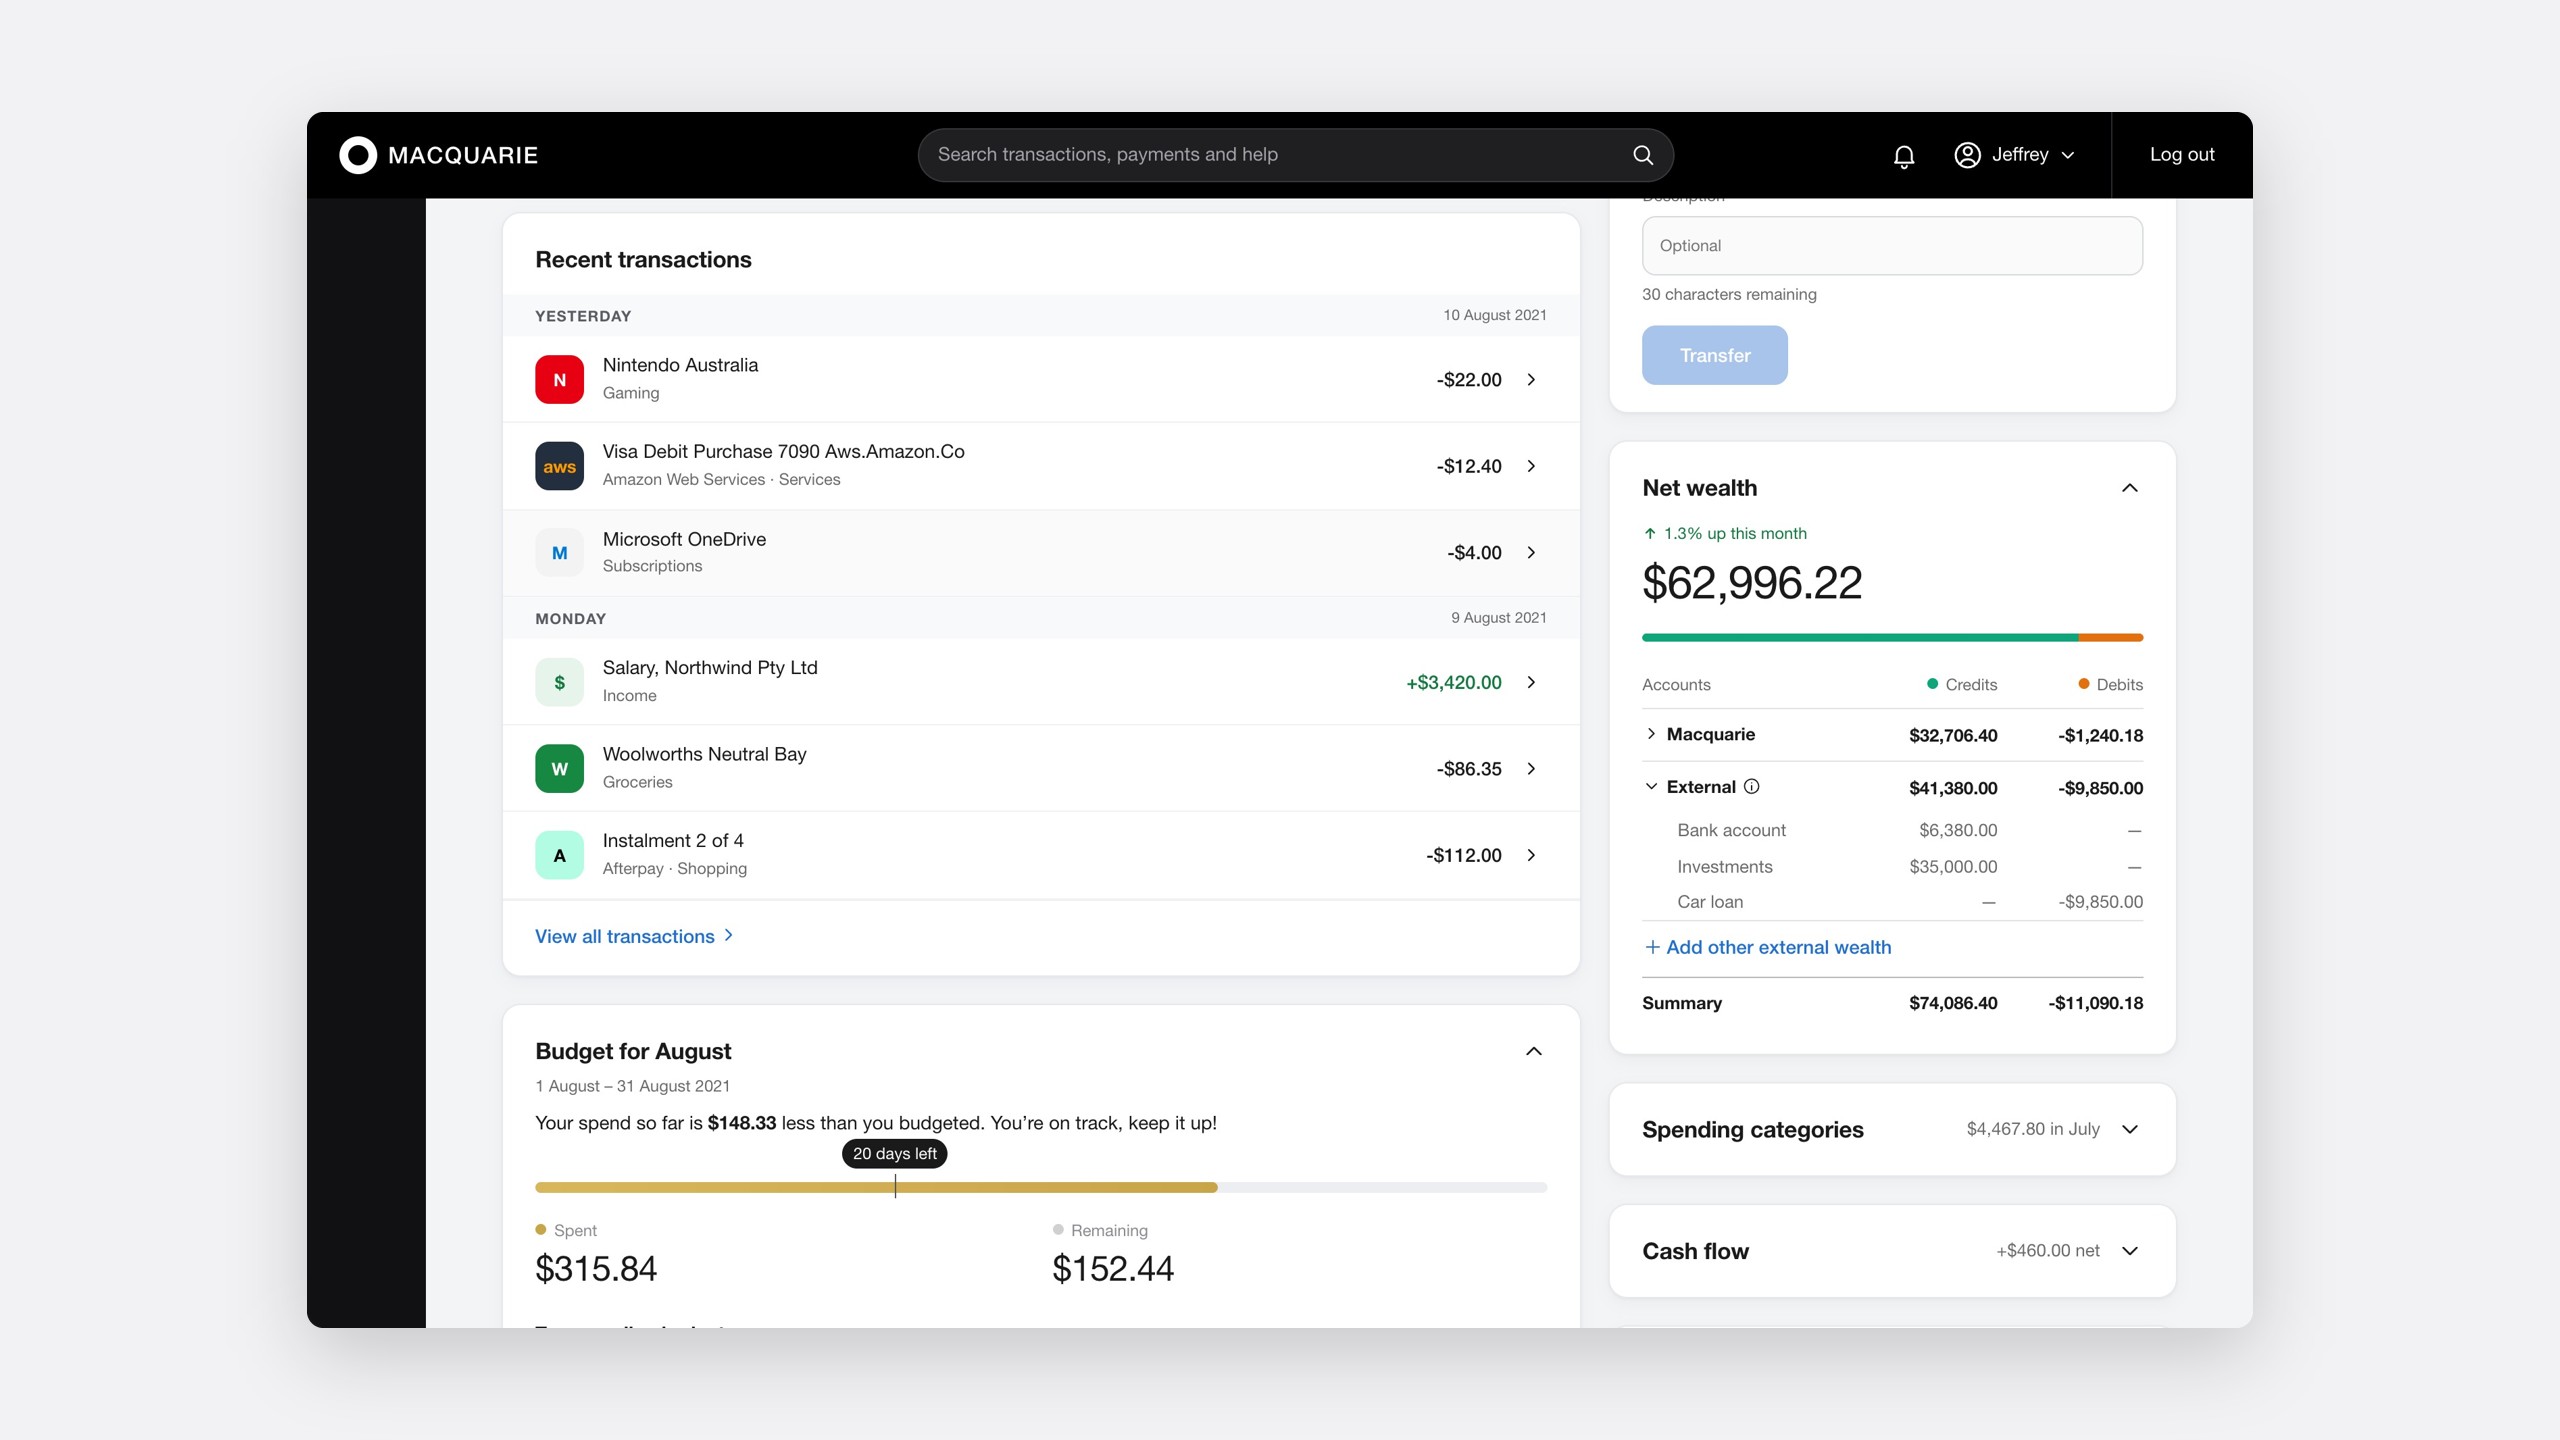
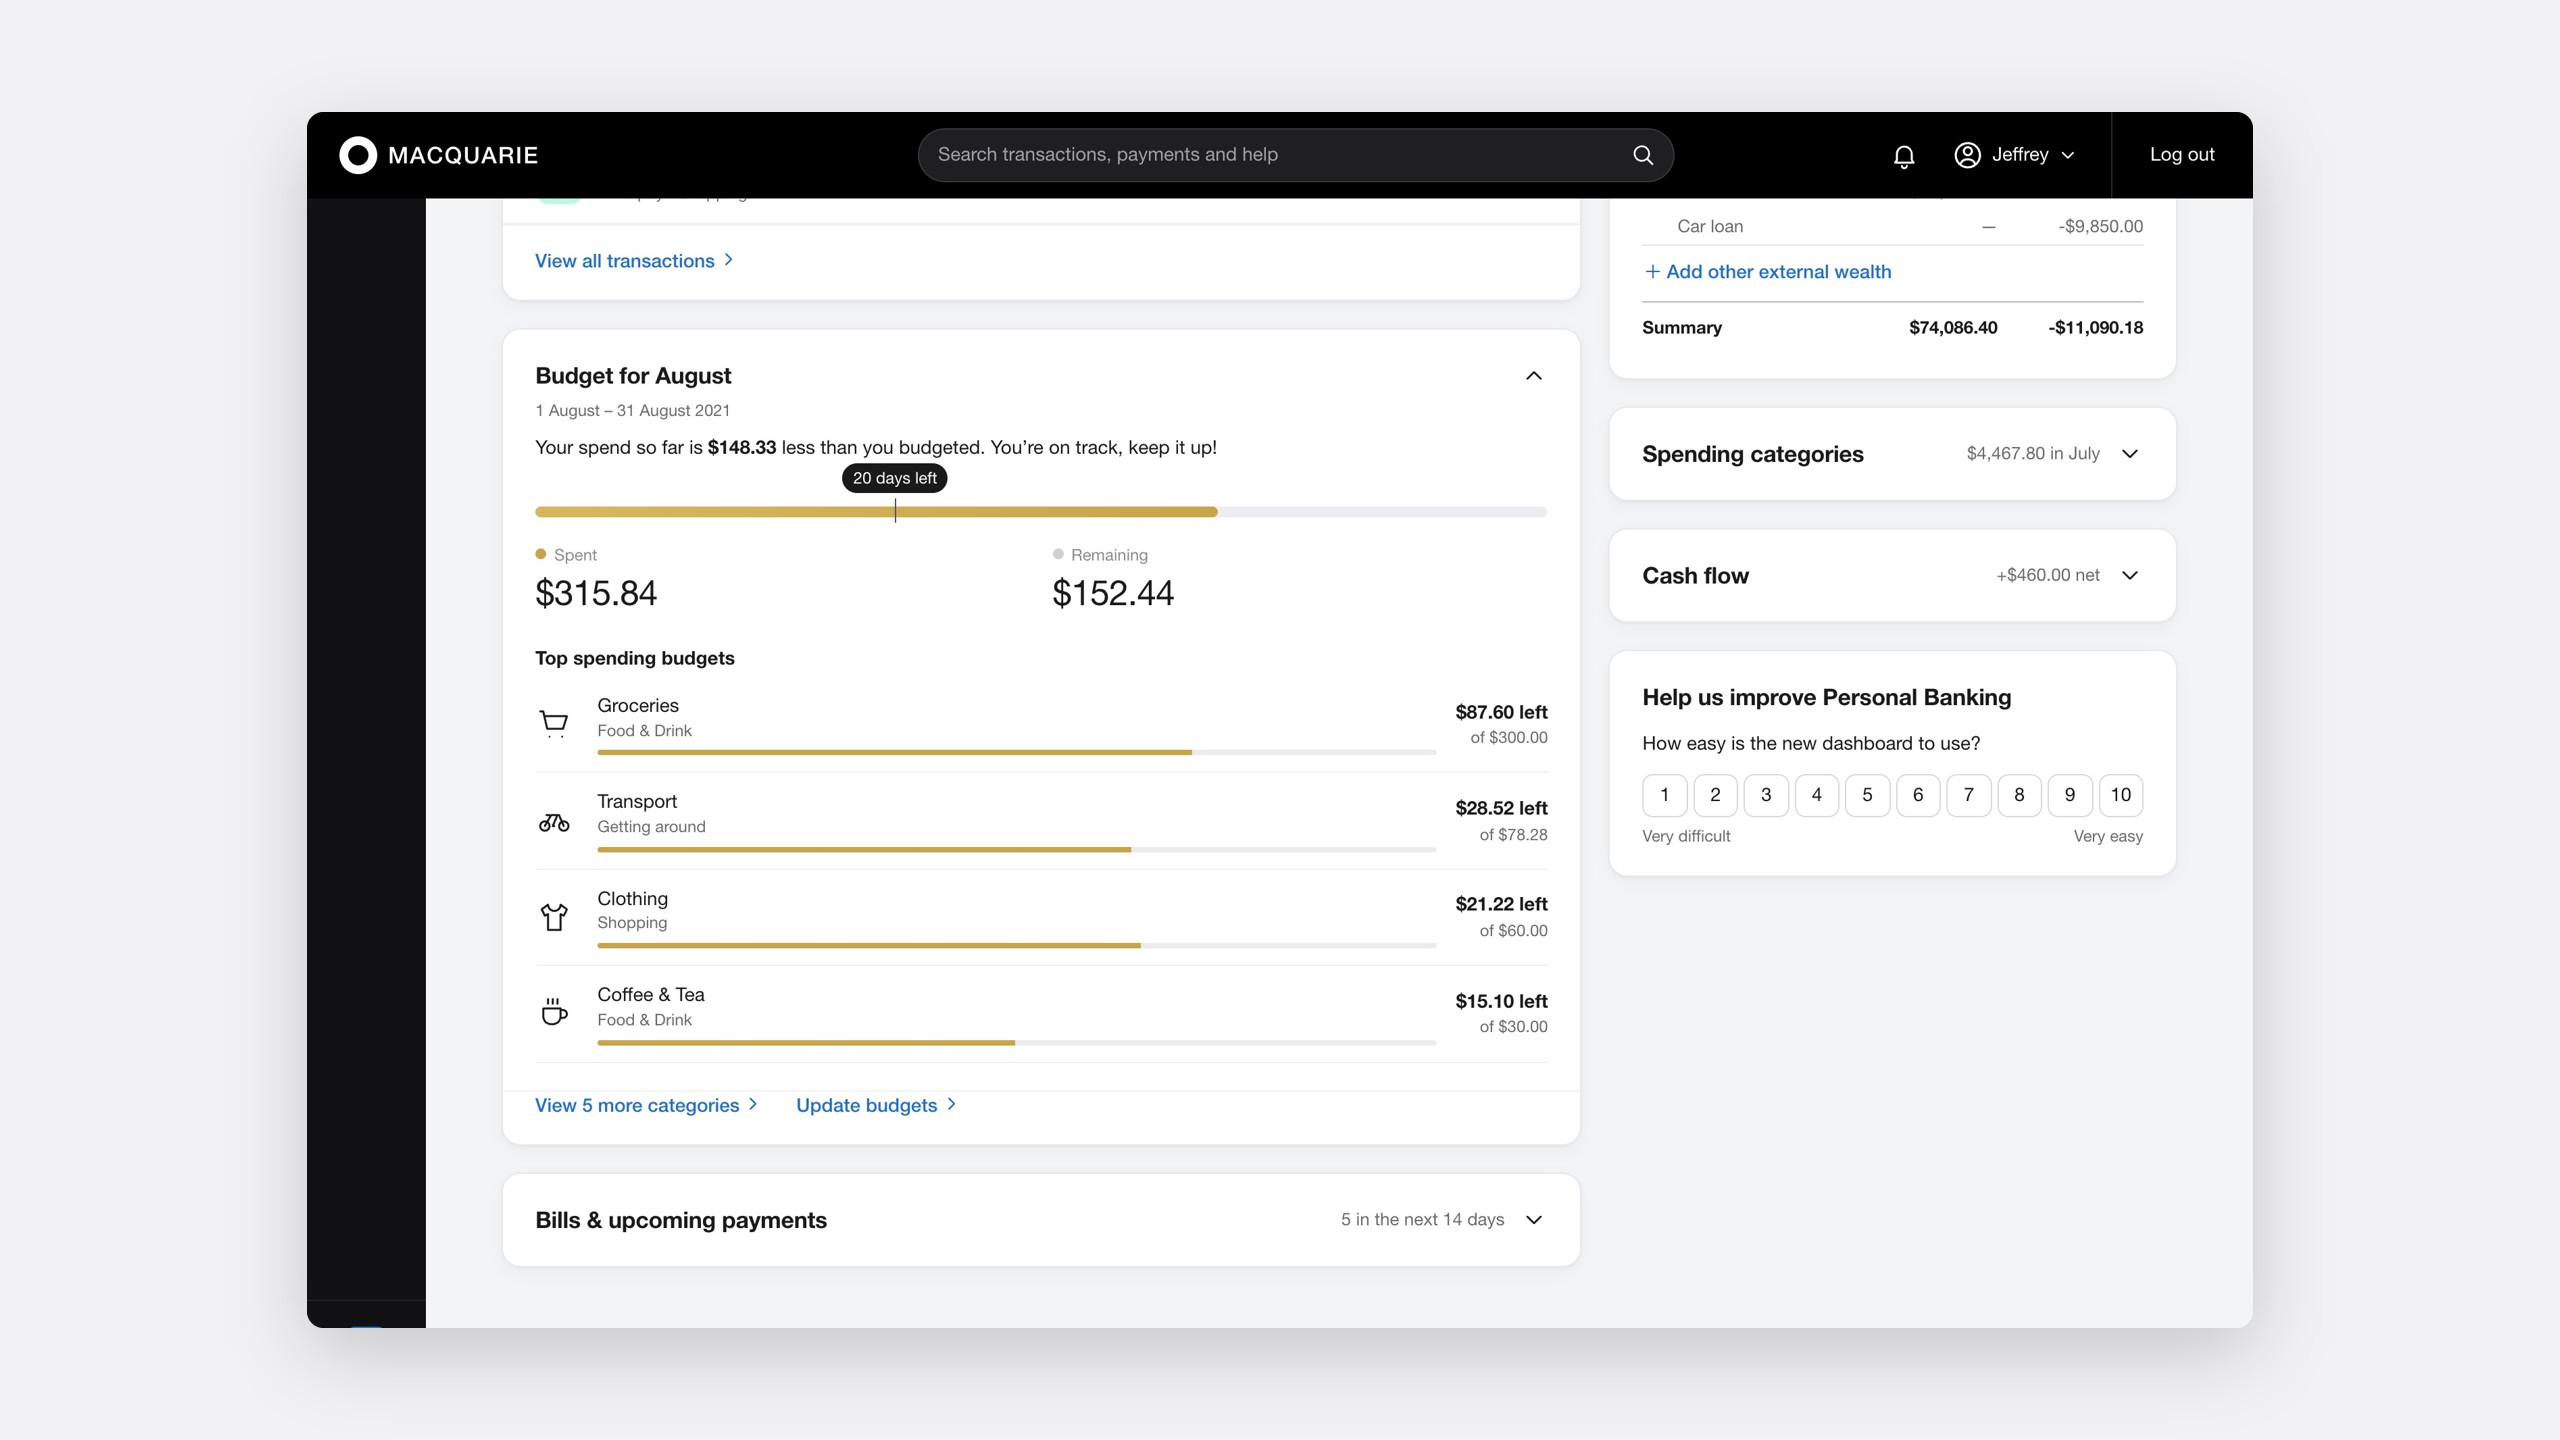
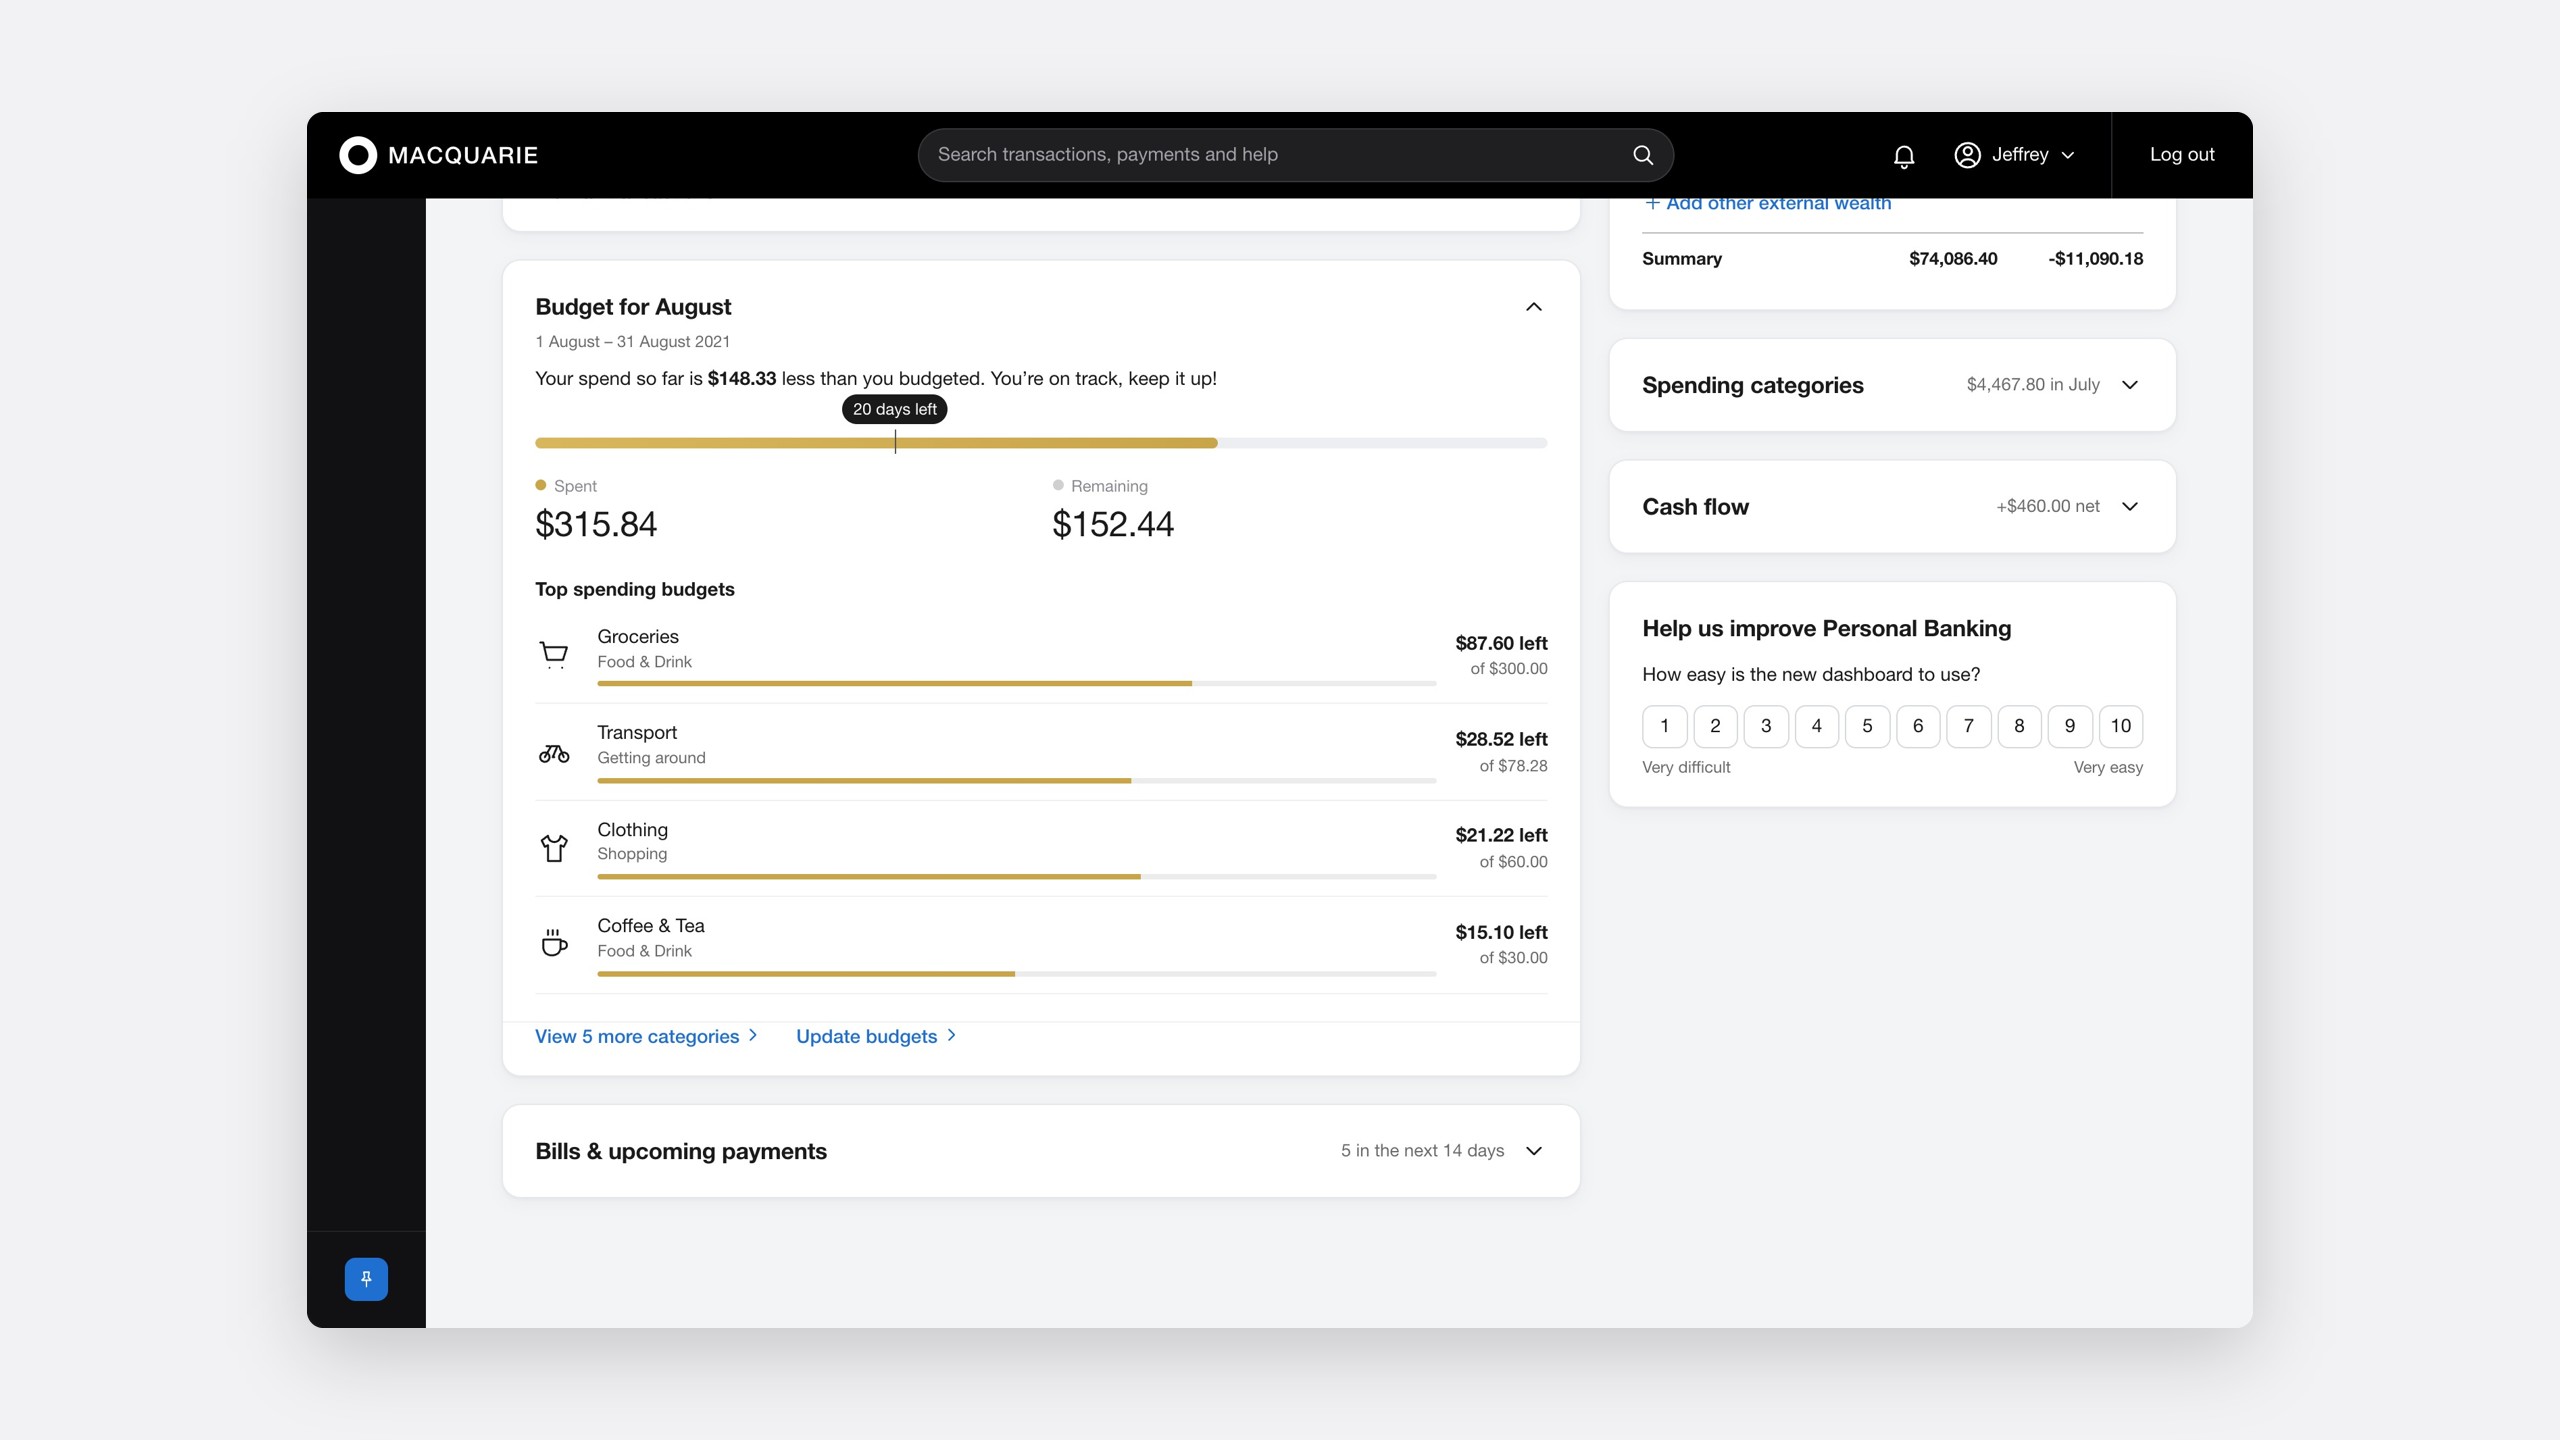
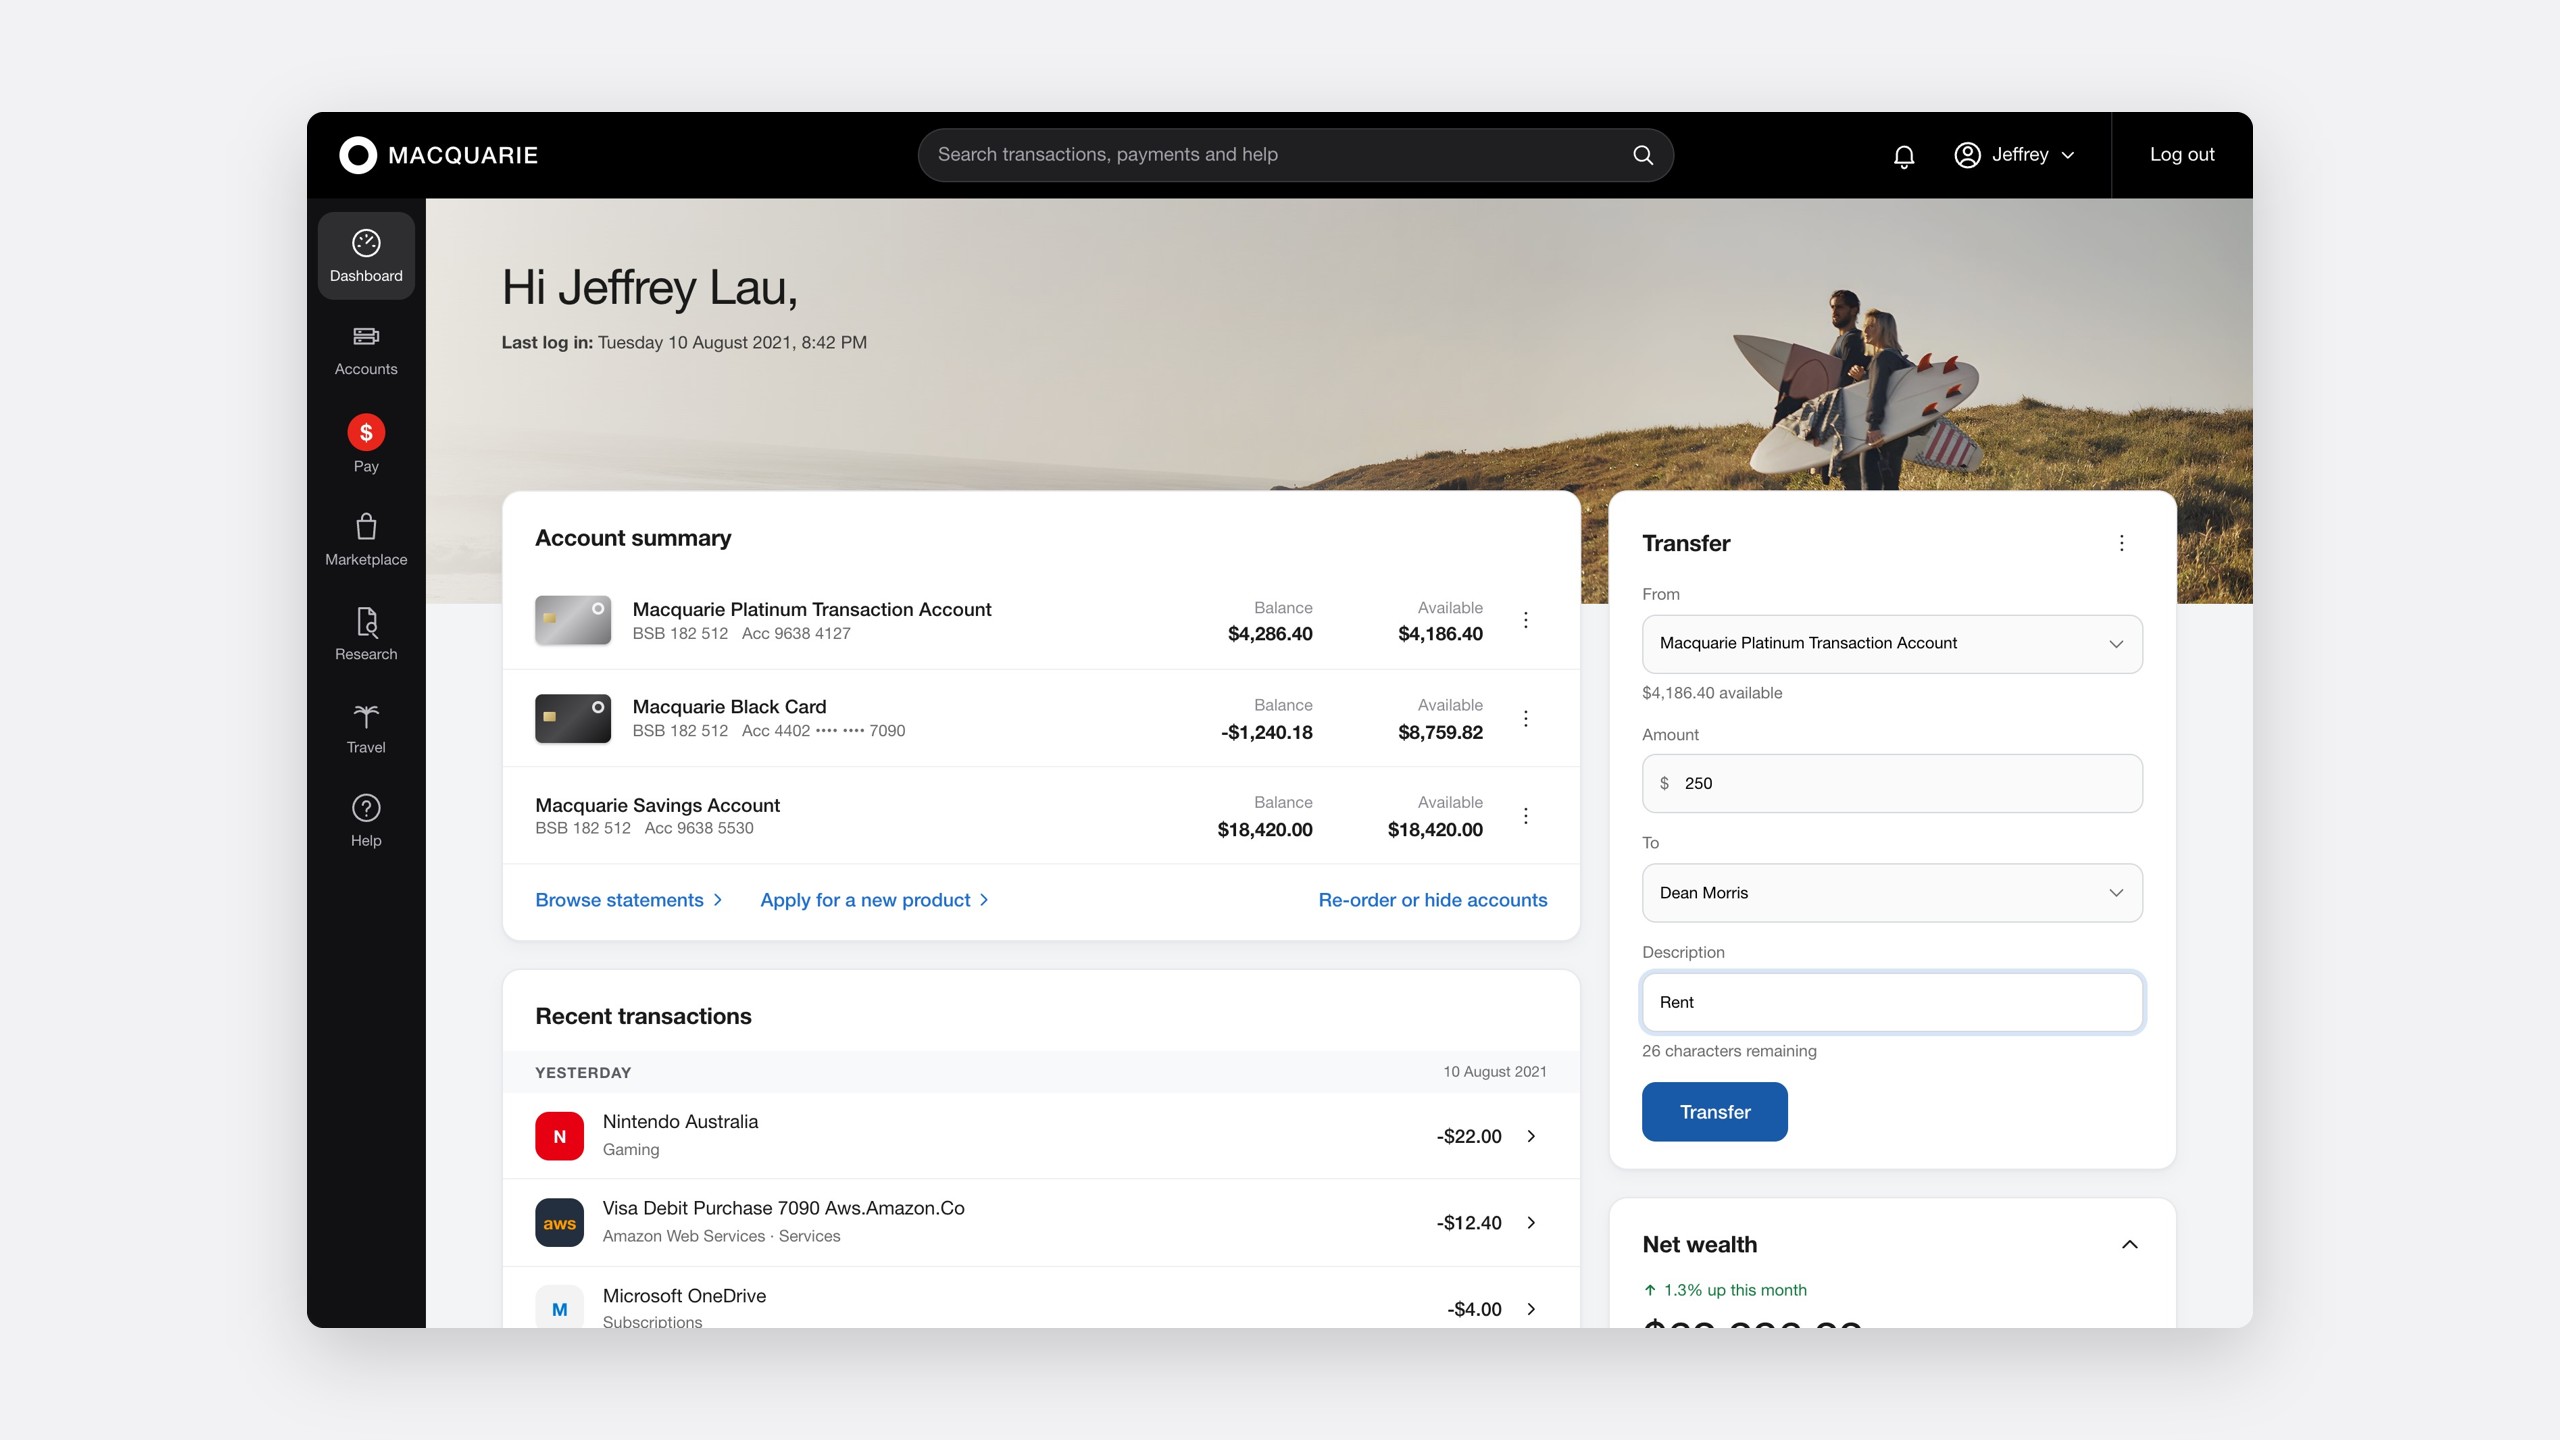
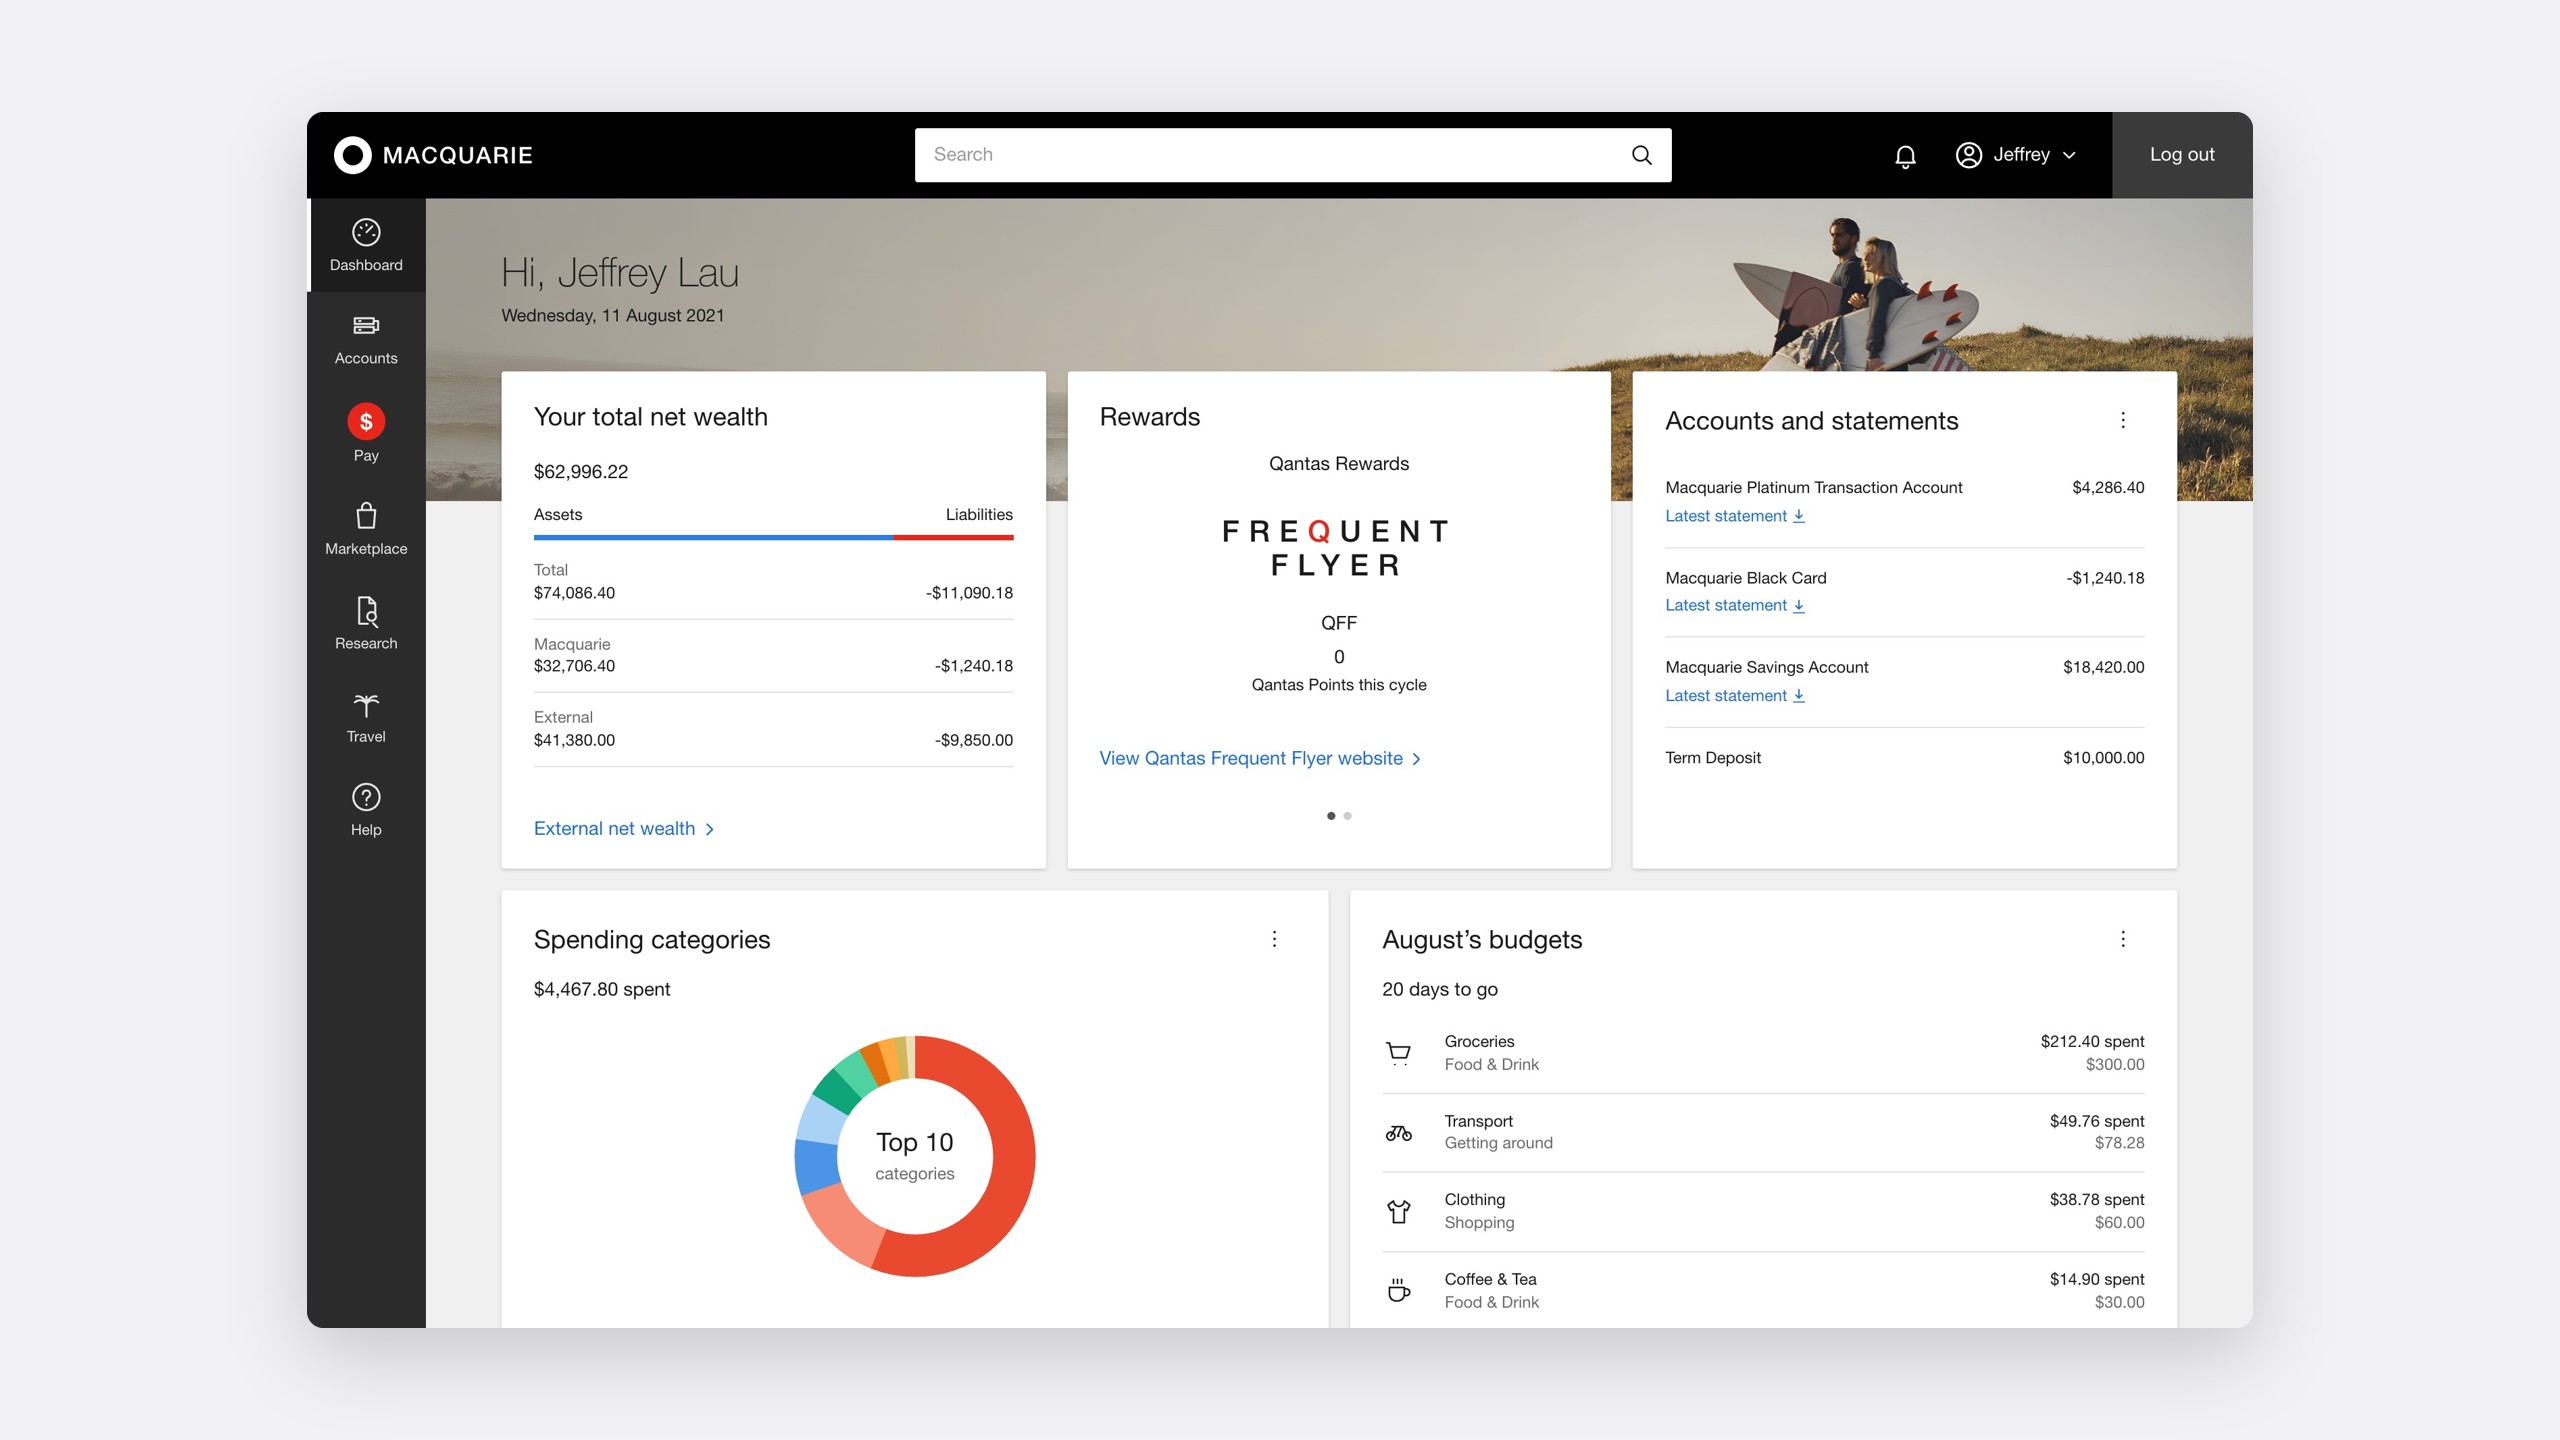
Every one of Macquarie's 400,000 personal banking customers, about 60% of them online, lands on the dashboard after signing in. In 2021 I redesigned it, from a year of feedback through nine rounds of usability testing to an A/B test, and built its components into OneUI, Macquarie's design system.

Role
Product Designer, and product owner of OneUI
Team
Personal Banking, OneUI, Data Analytics
Timeline
2021–2022
Platform
Web and mobile

6.38.9

ease of use, A/B tested with 1,831 customers

98%

final dashboard task success

532

participants over nine test rounds

The problem

The first screen answered the wrong questions

A banking dashboard should show customers where they stand, then get out of the way. Macquarie's had grown by addition: every team that wanted a place got a tile, and by 2021 there were nine in a rigid grid. Checking a balance sat at the same weight as a Qantas rewards card.

The dashboard before the redesign: nine equal tiles in rows of three, with net wealth, rewards and accounts across the top, and spending, budgets, transactions, a payments calendar and cash flow below
Before. Accounts, the tile customers ranked first, sat third in the top row.

Customers used it as a waiting room

The dashboard drew 13.9 million views a month, and most visits left straight away.

Where customers went next, in one month

Account activity35.06%
Accounts13.46%
Create payment9.78%
Wealth portfolio4.29%
Statements3.66%
Scheduled payments1.06%
Profile details0.9%
Payees0.83%
Google Analytics, 13,859,507 views. Nearly six in ten journeys went to an account or a payment.

Three quarters of sessions reached the second row of tiles, and only half the third.

A year of feedback, in one place

With the analytics team I pulled twelve months of complaints from Medallia, CX&O call notes and app store reviews together, and clustered them by theme.

A year of dashboard feedback, by theme

I have to scroll to find my accounts31%
Too many steps to pay or transfer24%
Tiles I never use19%
Balance or available, which is it?14%
Was that login me?12%
About 2,400 comments, January to December 2020.

The affinity map, in customers' words

I have to scroll to find my accounts

31% of comments

I find it difficult to get to where I want to be… which is get to my accounts

Not sure why when I log in it goes to the dashboard. It isn't all that helpful

Cannot find what I am looking for… navigation

Too many steps to pay or transfer

24% of comments

Wish I can make a quick payment

It's confusing how to make a payment. I have to go through multiple steps

Tiles I never use

19% of comments

I don't really care about the Rewards

Spending categories don't work too well

Want a quick way to look at the budgets

I don't like seeing the negative balances, not sure why I need 'net wealth'

Balance or available, which is it?

14% of comments

Was that login me?

12% of comments

Want to ensure that my account is secure

My role

Lead designer on the dashboard, owner of the system

I was the product designer for the Personal Banking dashboard, working with a product owner, a tech lead and a squad. I led research, design, testing and accessibility, and product-owned OneUI, so every component the dashboard needed could be built once for every team. The design team grew from two to five.

Research

Who signs in, and why

Segmenting by behaviour, not demographics

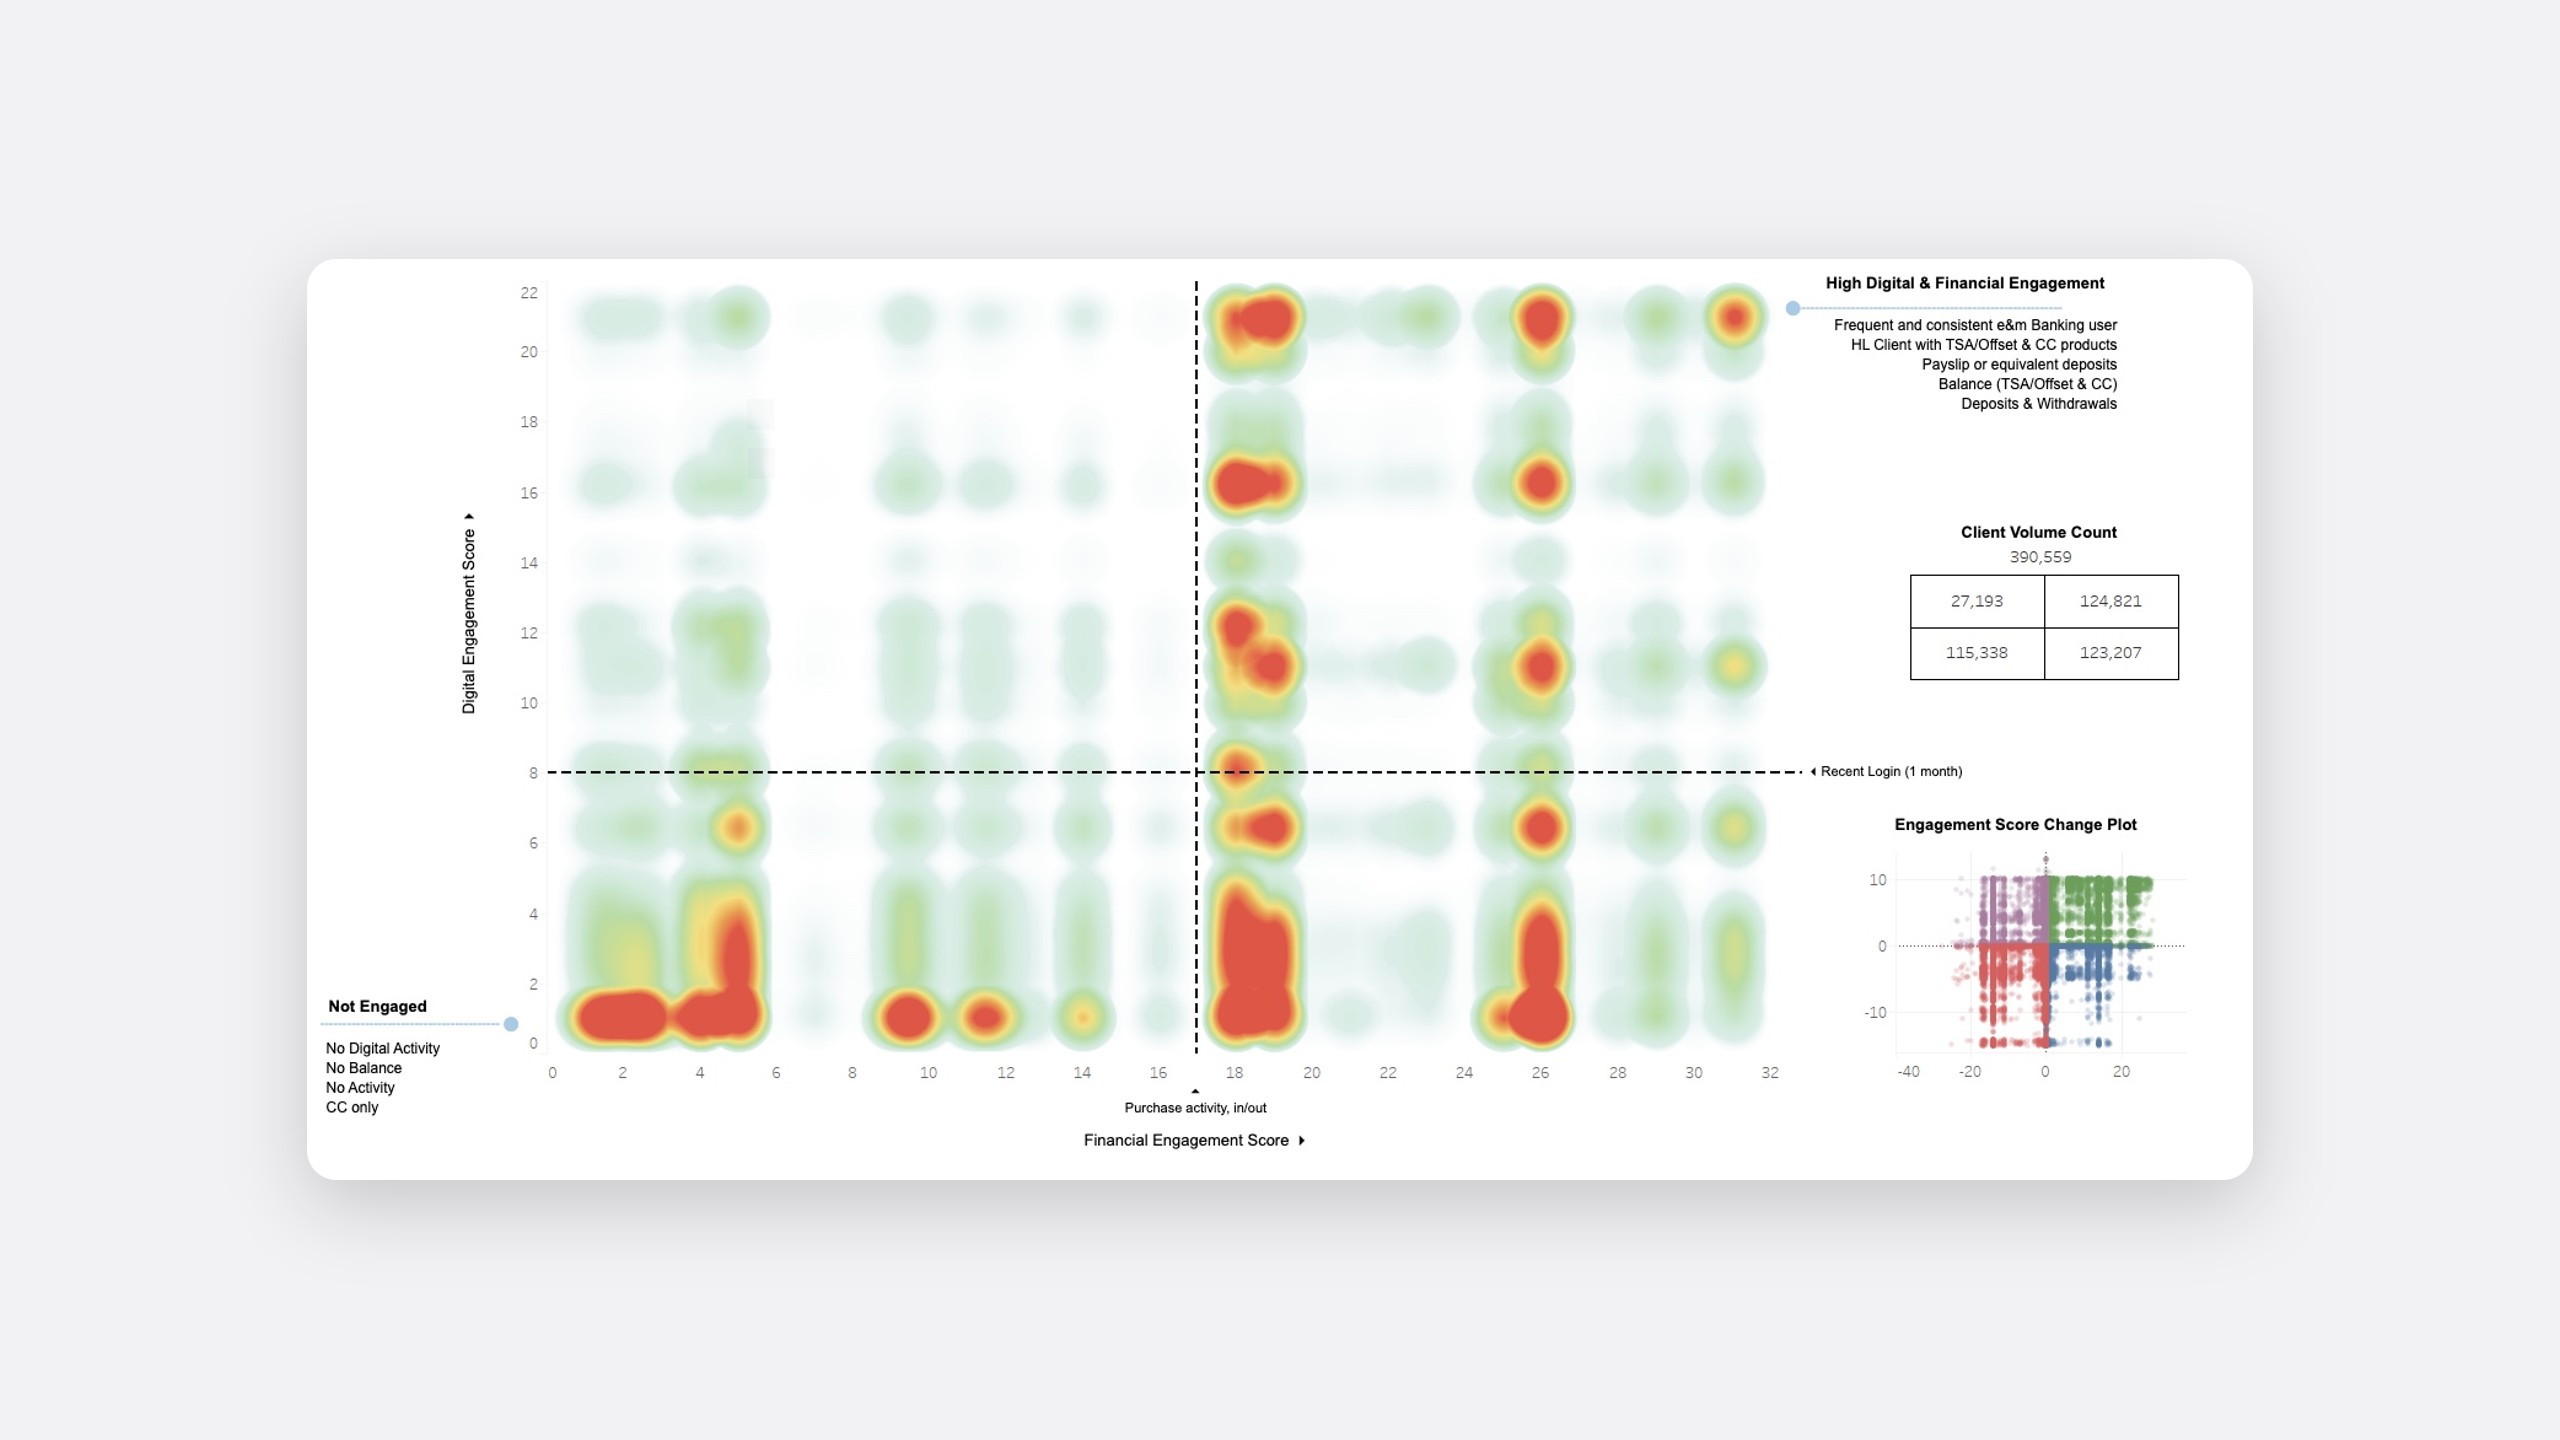
Macquarie's personas described who customers were, not what they did. With the analytics team I built goal-directed personas from data instead, plotting 390,559 clients in Tableau by digital engagement and products held.

Low product holding High product holding
Highly active online 27,193 124,821
Rarely online 115,338 123,207
The Tableau heatmap of client engagement: digital engagement score up the side and financial engagement score along the bottom, split into four quadrants by a recent login and by purchase activity. Hot spots sit bottom left for customers with a credit card only and no digital activity, and top right for home loan customers with an offset account, credit card and salary paid in. A client volume table and an engagement score change plot sit to the right
The biggest cluster had a home loan, an offset account and their salary paid in. They sign in often, to check and move money.

Two personas that pull in different directions

Of seven personas, two shaped the dashboard most, because each needed nearly the opposite thing first.

Everyday banking · the largest group

Peter, 32

Administrative officer, married

He is saving for a home loan and worries most about missing a bill.

Holds
  • Transaction account
  • Savings account
  • Term deposit
Goals
  • Save for a home loan deposit
  • Competitive interest rates
Signs in to
  • Check his balances
  • See whether his pay has landed
  • Pay a bill or move money
Wealth · fewer customers, higher value

Jane, 42

Private banking client, married

She is confident online and wants to see and protect her whole wealth at a glance.

Holds
  • Transaction account
  • A large, diverse portfolio managed by the private bank
Goals
  • See her whole wealth at a glance
  • Safeguard her wealth
Signs in to
  • Check her net wealth
  • See how her portfolio has moved
  • Review what is coming up

Asking, then counting

11

One-on-one interviews

55

Survey responses, aged 18 to 75+

13.9M

Dashboard views in Google Analytics

All 11 interviewees had a transaction account, 8 had savings and 2 a home loan. They signed in with a purpose: check a balance, see whether they've been paid, then pay or transfer. The surprise was security. Several wanted to see the last login, to check nobody else had been in.

QWhen you first log in, what would you like to see first?

Account balance for each of my accounts.

Survey respondent

My account balance, and maybe my most recent transaction. Have I been paid?

Survey respondent

A button to immediately transfer $100 from savings to my transaction account, for when my card is declined at the register.

Survey respondent

The survey's top three matched what the analytics said customers left to do.

Ranked in respondents' top three

Account summary89%
Transfer funds71%
Recent transactions67%
Bills and upcoming payments42%
Budgets29%
Net wealth25%
Spending categories18%
Cash flow11%
Rewards7%
n = 55. Rewards, the old dashboard's second tile, came last.

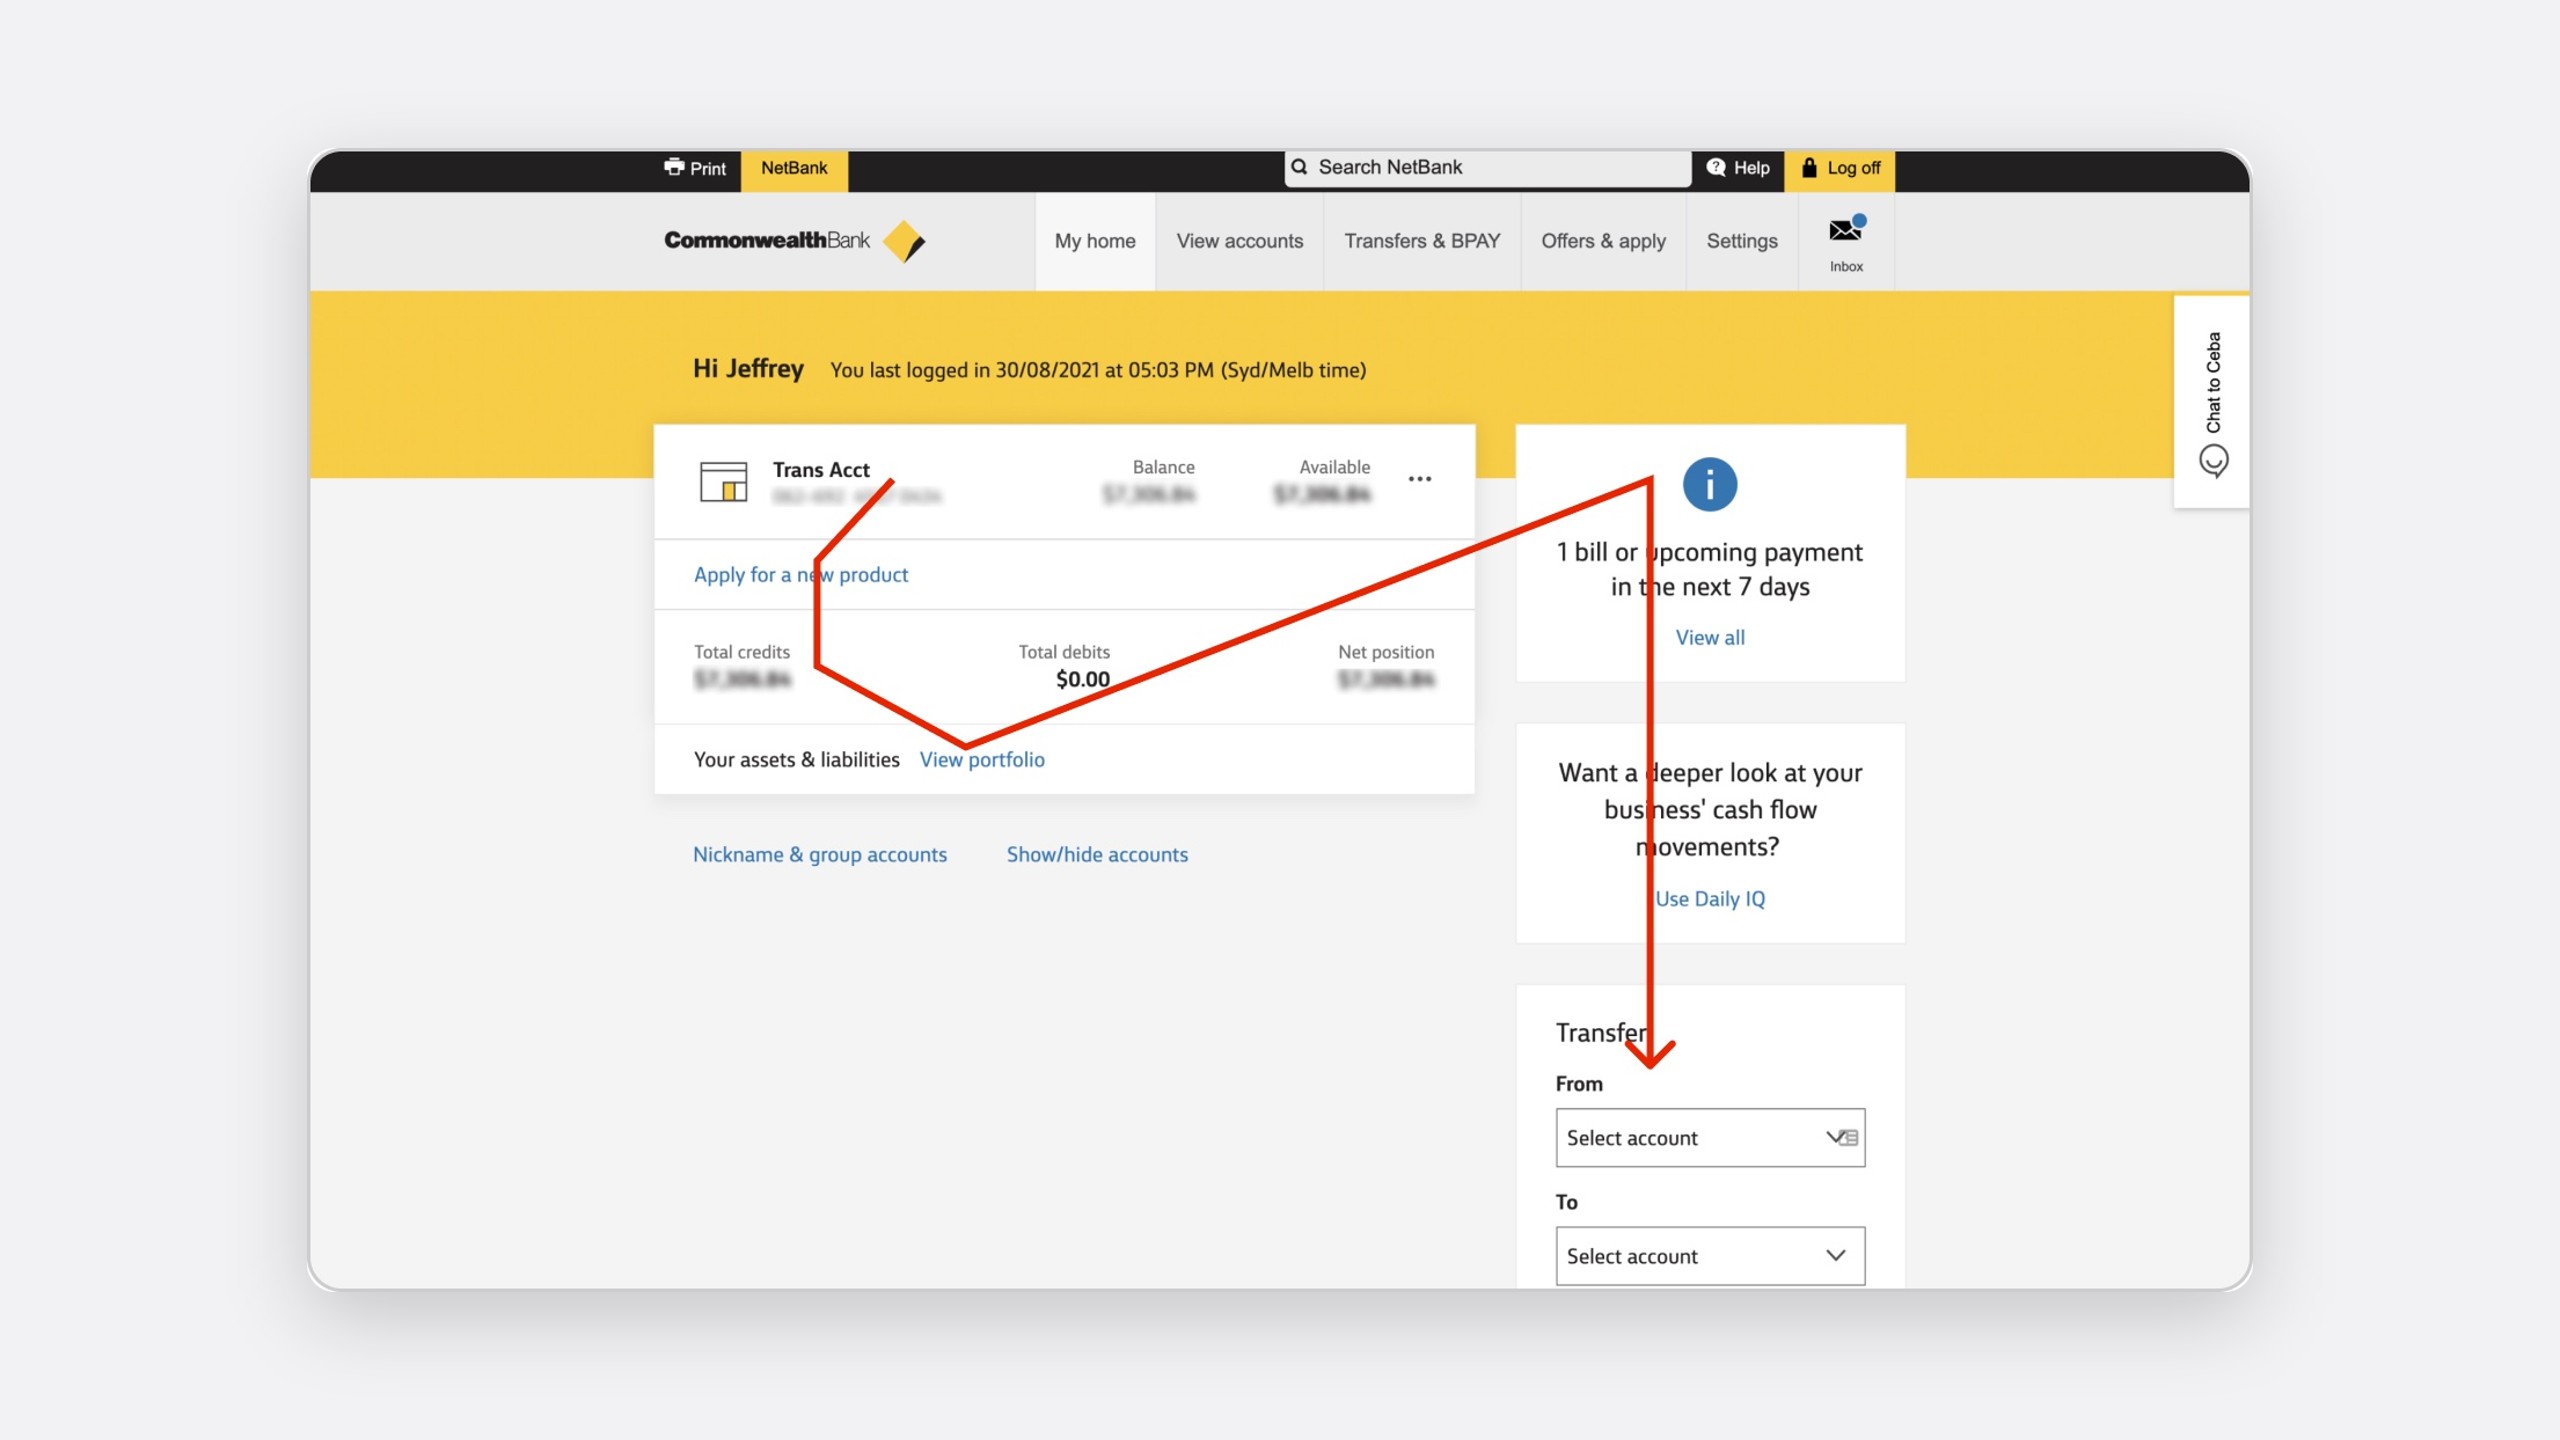
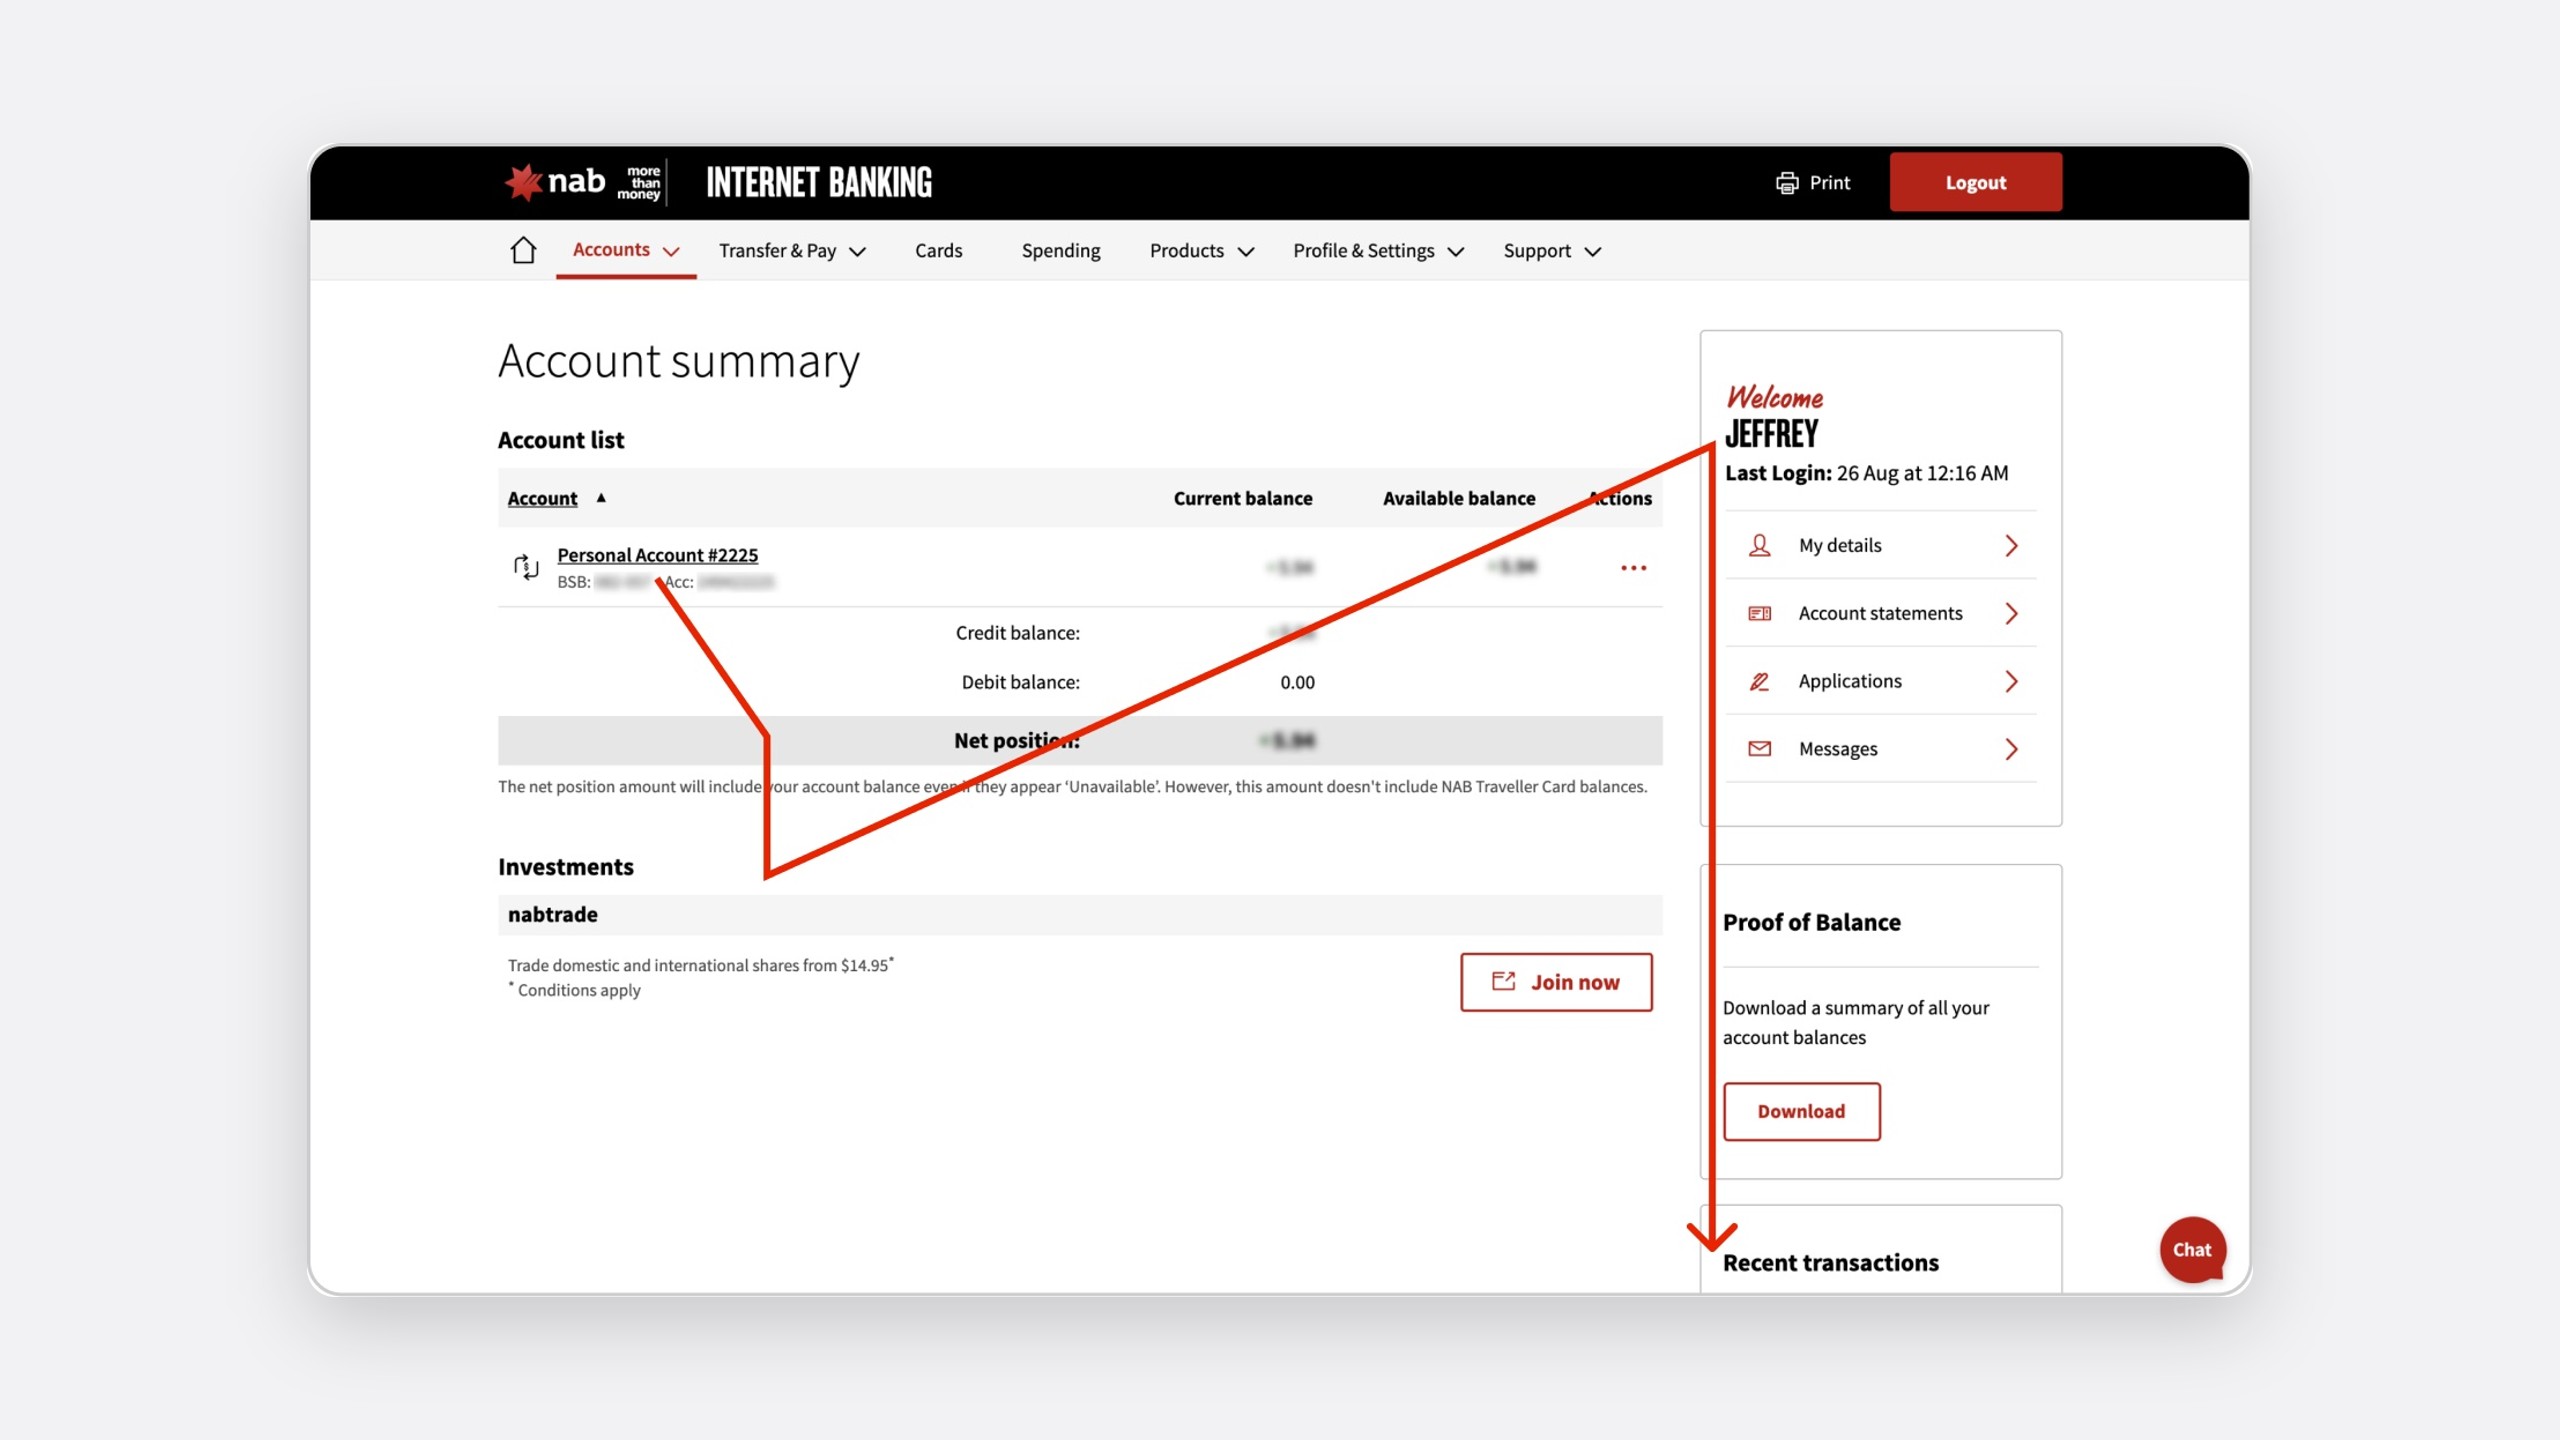
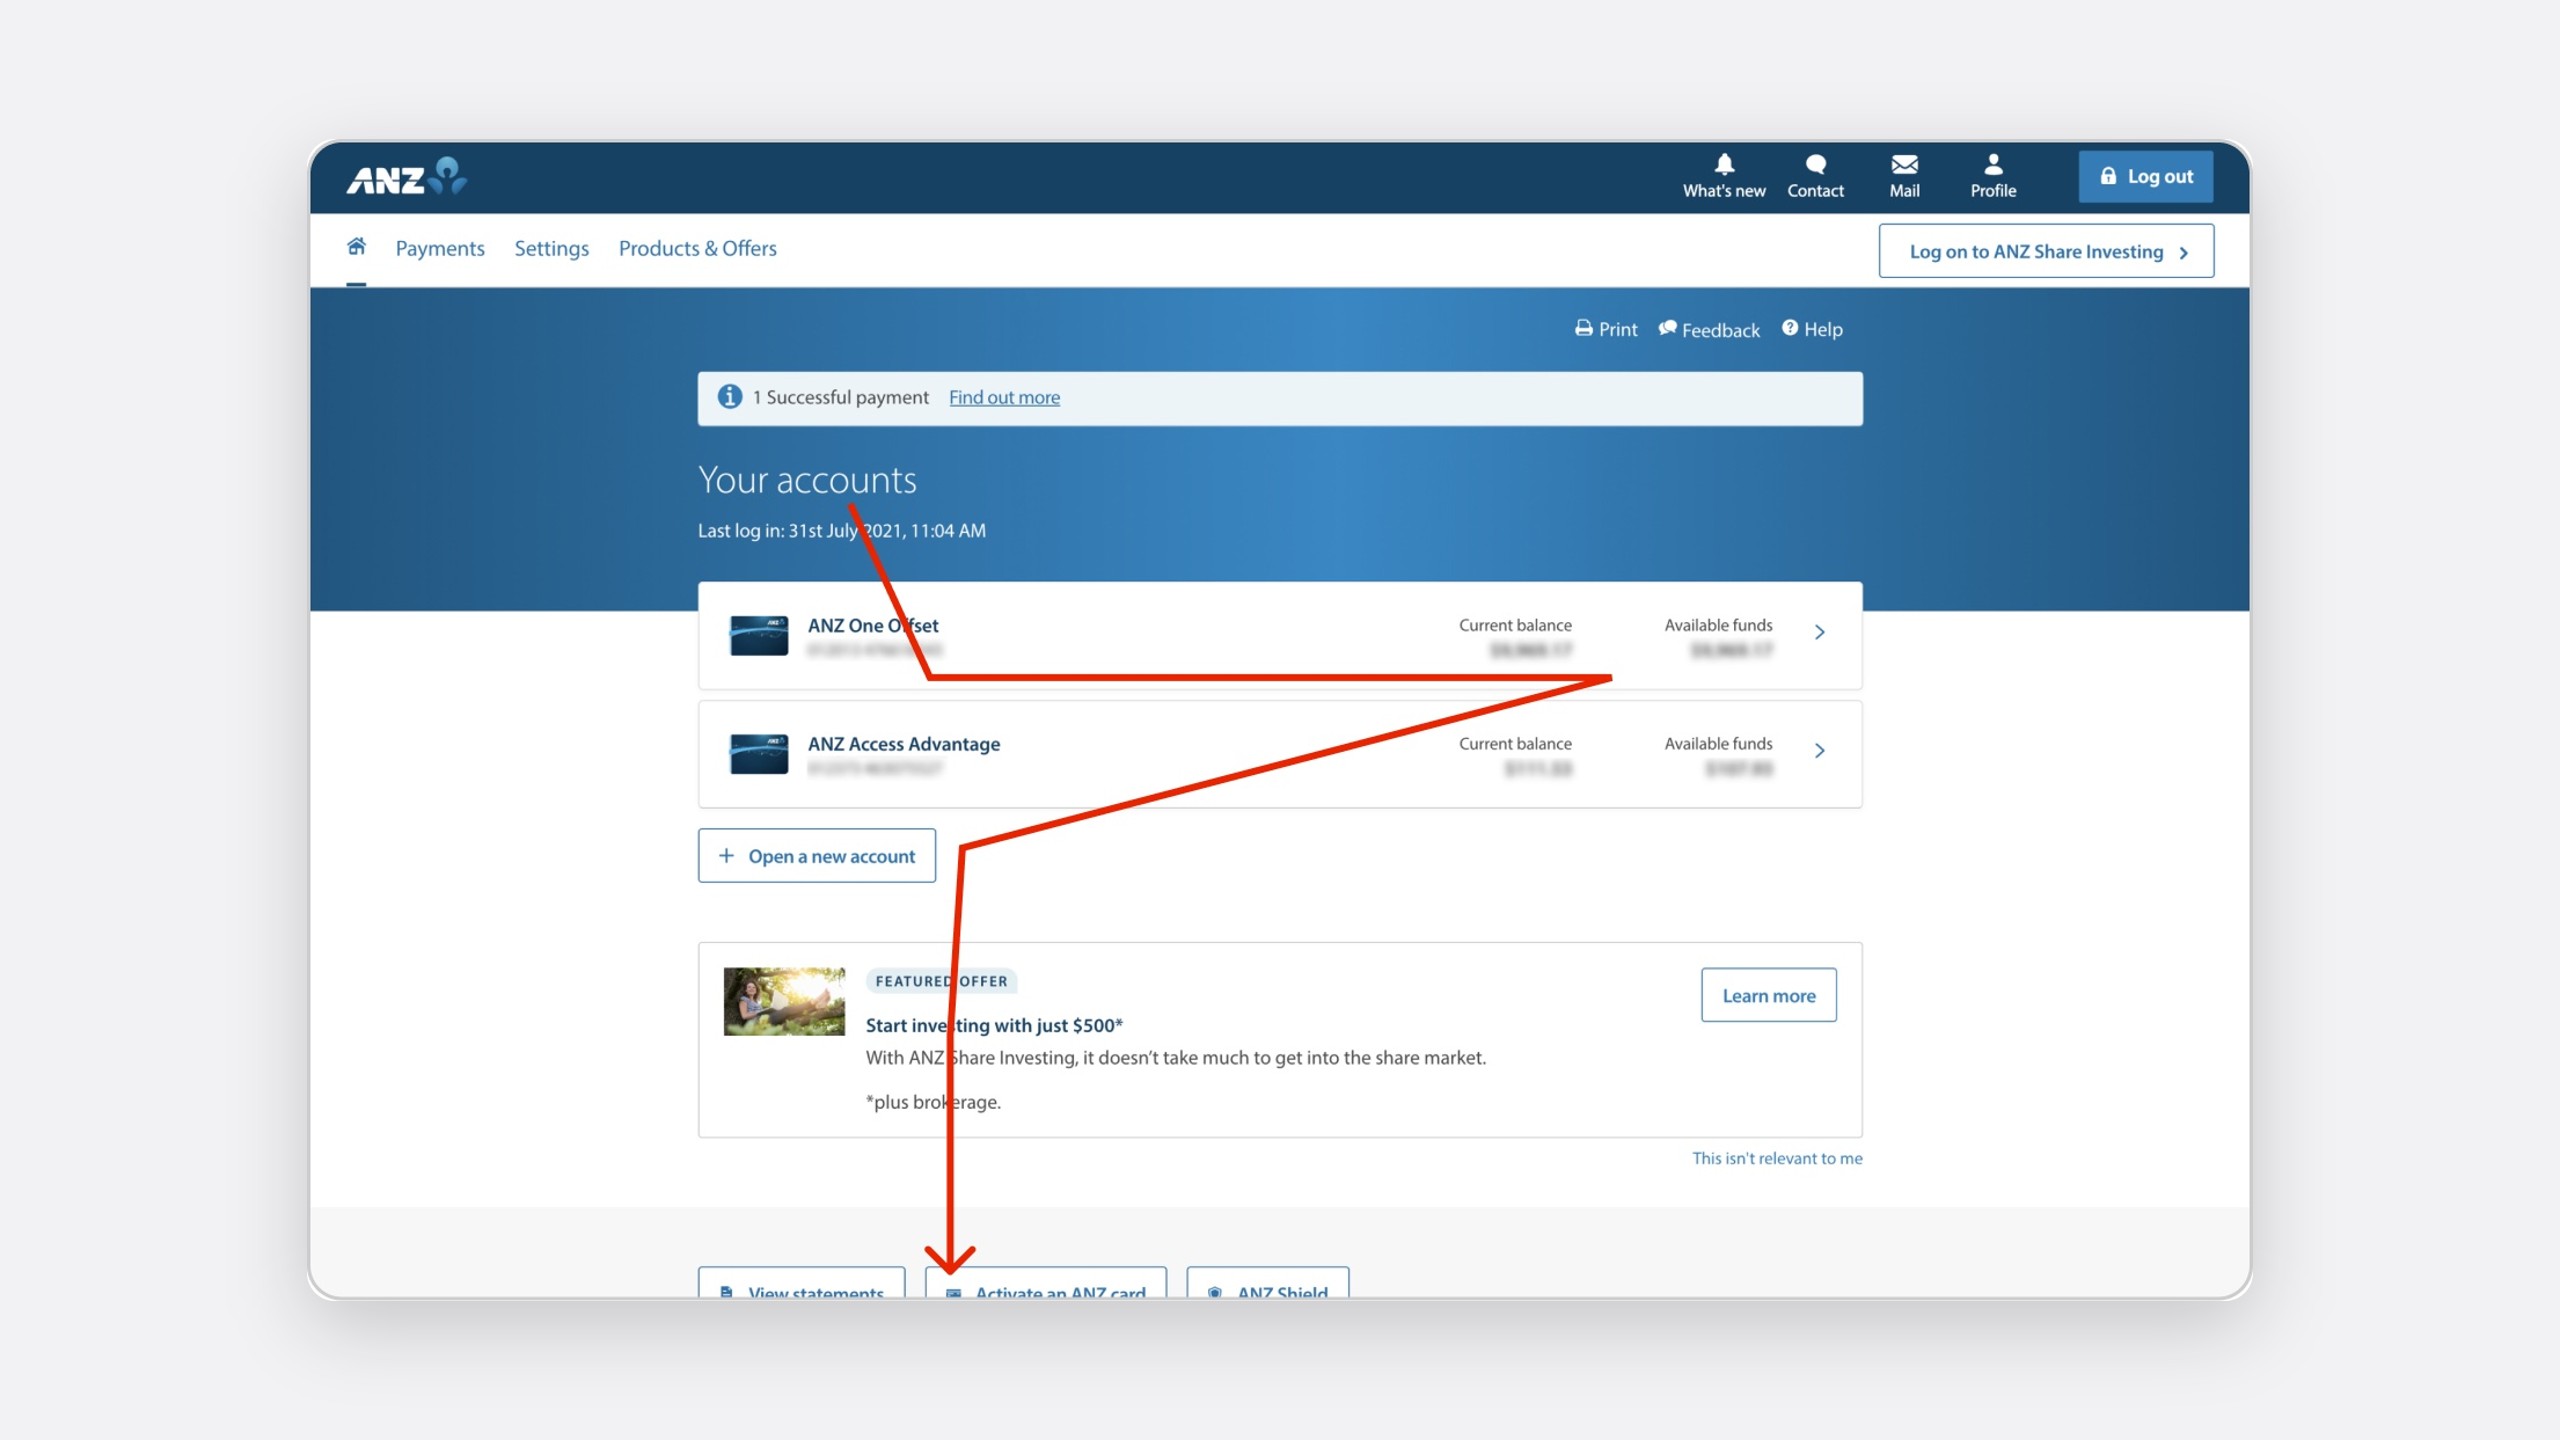
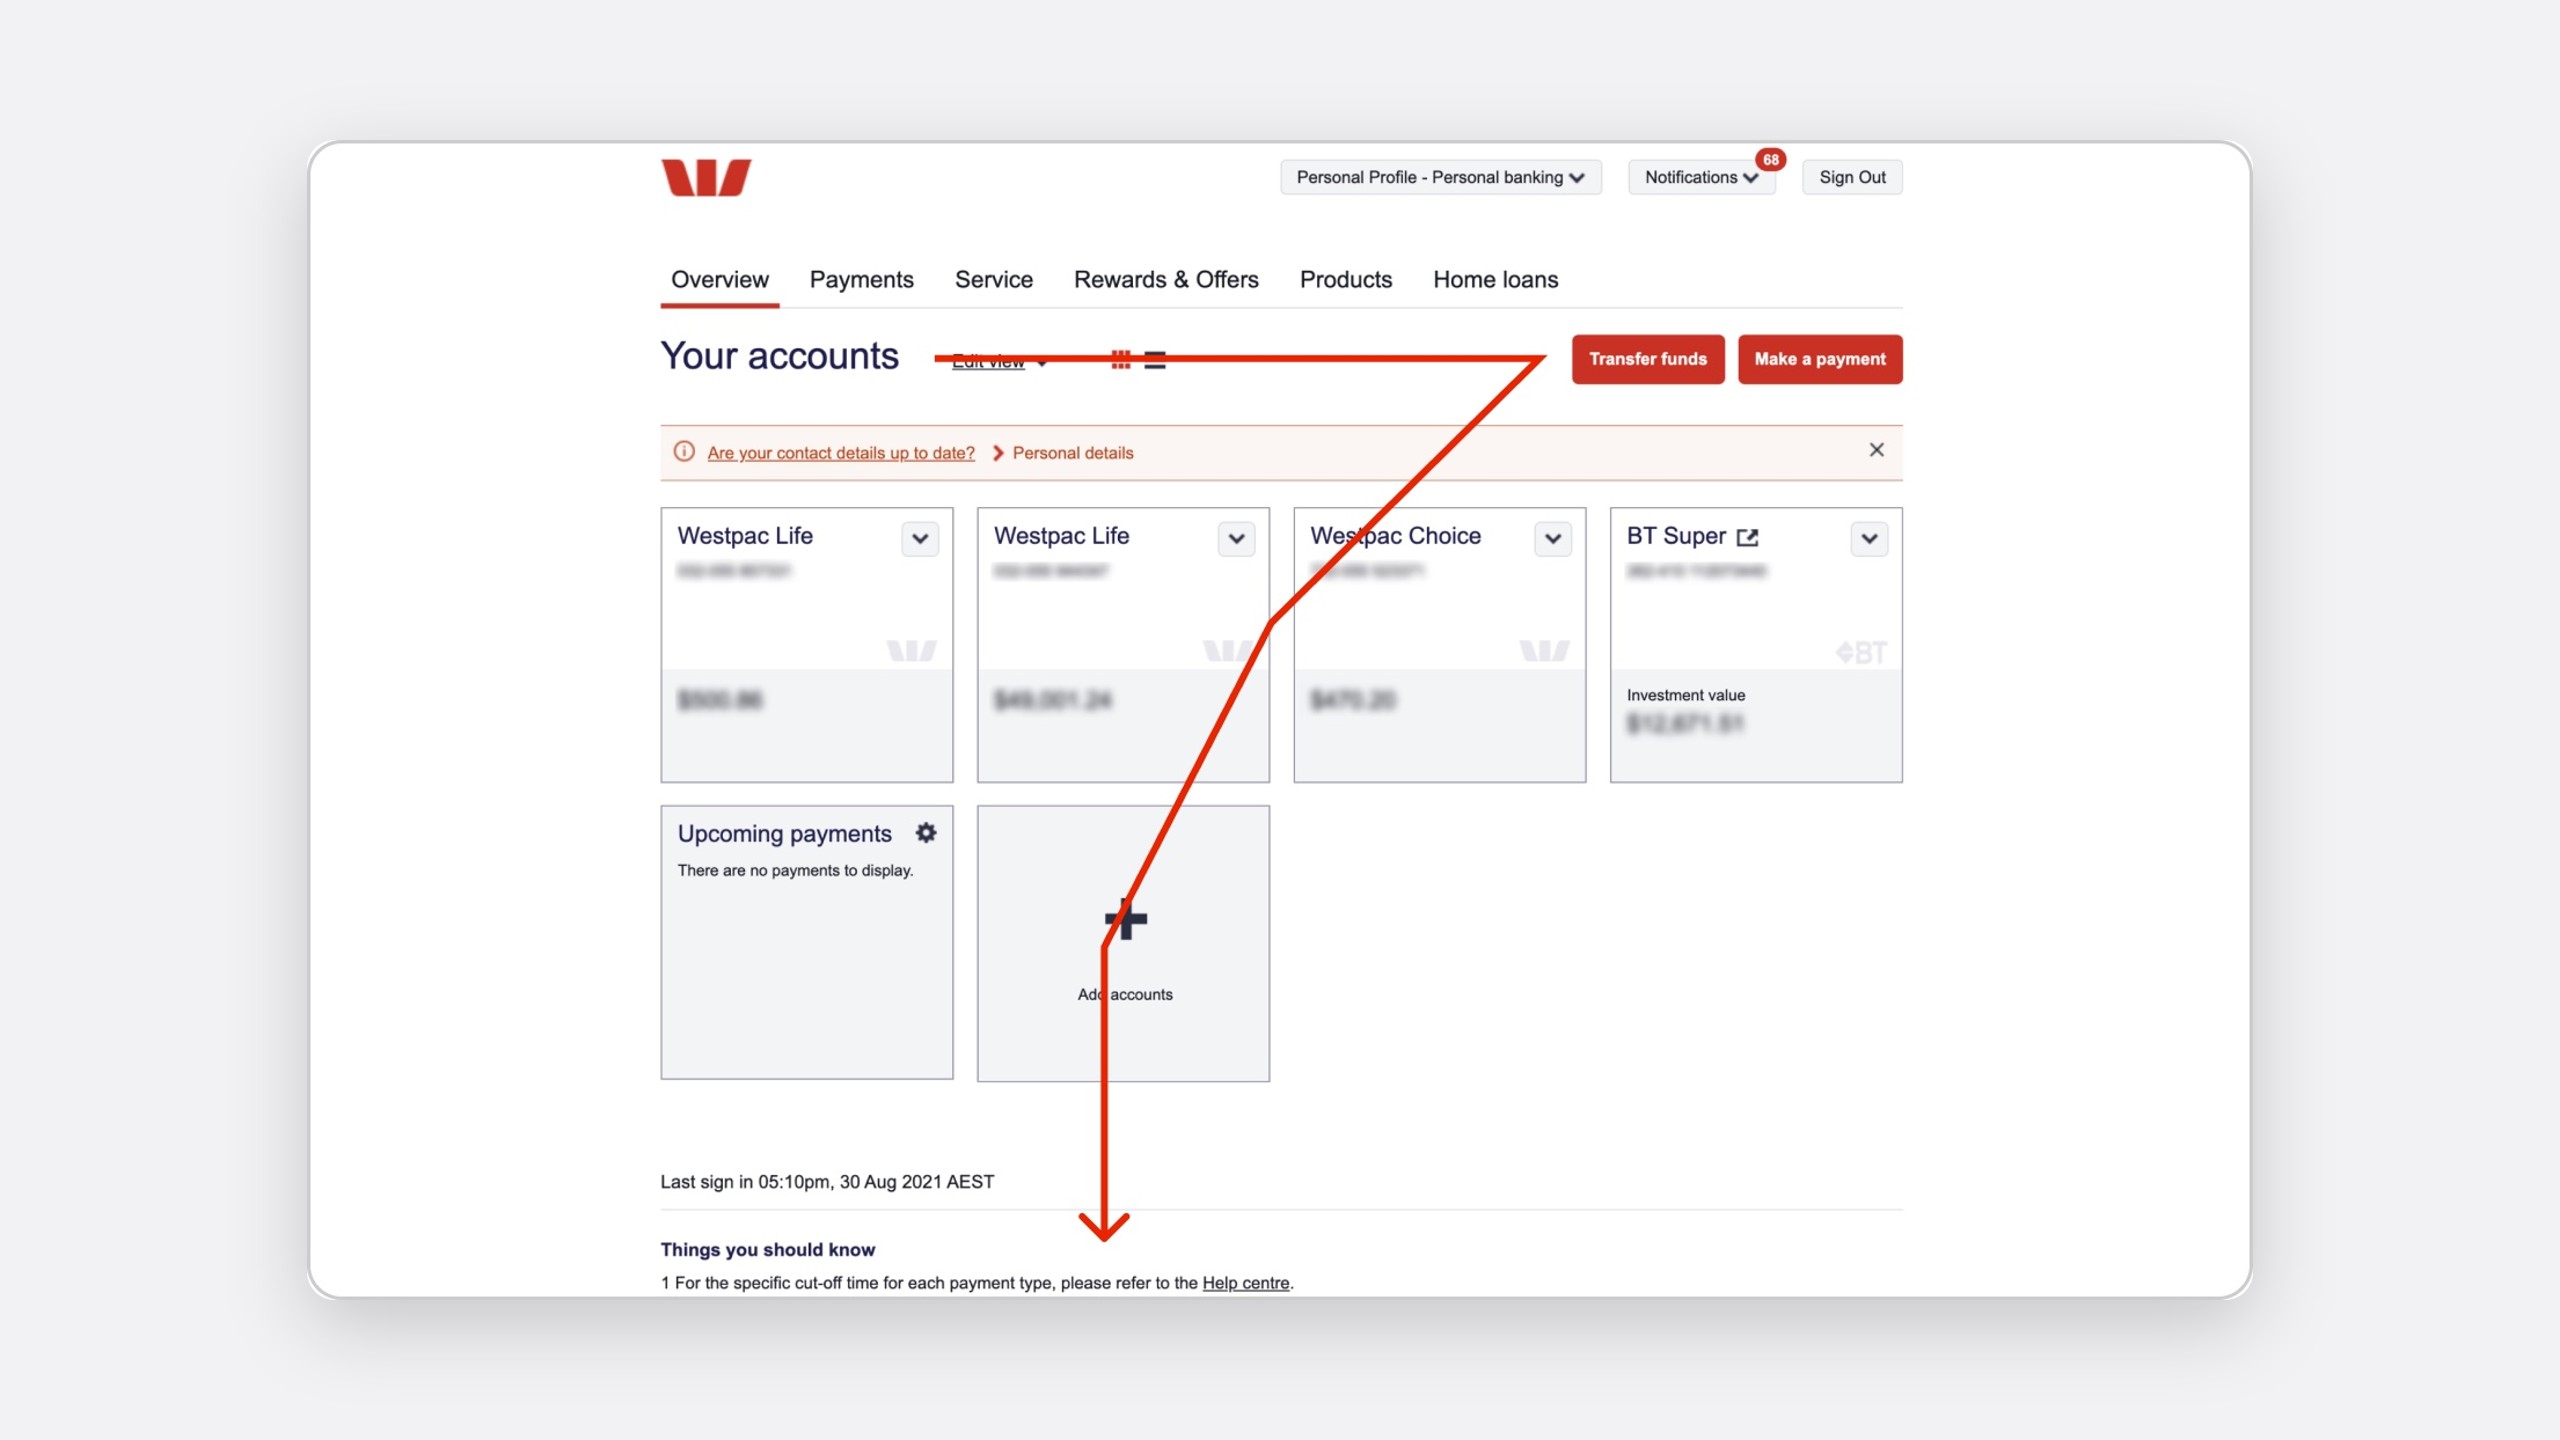
What other banks had settled on

I reviewed ten dashboards, and the big four Australian banks in depth.

CommBank NAB ANZ Westpac
Accounts first Yes Yes Yes Yes
Primary and sidebar columns Yes Yes No No
Transfer or pay from the dashboard Sidebar No No Yes
Last signed in No No No Yes
Net position Yes Yes No No

Take

What Macquarie should do

Accounts first, with both balances. Transfer and pay without leaving. The last sign-in and upcoming bills.

Leave

What Macquarie should avoid

Accounts as cards, repeating the Accounts page, proof of balance, and filling space because it is there.

Design

One column for the job, one for context

From rows to columns

In rows, every tile matched the tallest beside it, so the most important one fought its neighbours for attention. Nielsen Norman Group found 74% of viewing time falls within the first two screenfuls, so I moved to two columns on OneUI's 12-column grid: a wide one for the jobs customers came to do and a narrow one for context, with accounts top-left, where people look first.

Before

Rows

Fixed heights and nine tiles of equal weight.

After

Primary and secondary columns

Variable heights, a clear first read, and collapsible secondary widgets.

Columns let each widget be as tall as its content.

Re-ranking every widget

A card sort with three participants checked the groupings, and the survey and analytics set the order.

Widget Customers ranked it Before, on the page After, everyday banking
Account summary 1st 3rd Primary, top
Transfer 2nd Not on the dashboard Secondary, top
Recent transactions 3rd 6th Primary, second
Bills and upcoming payments 4th 7th Primary, fourth
Budgets 5th 5th Primary, third
Net wealth 6th 1st Secondary, collapsible
Spending categories 7th 4th Secondary, collapsed
Cash flow 8th 9th Secondary, collapsed
Rewards 9th 2nd Moved to the Rewards page

Two defaults, not one

That ranking served Peter, but Jane signs in for her net wealth. Rather than average the two, each gets its own default built from the same widgets.

Default dashboards

Same widgets, a different order

Everyday banking

Peter

  • Primary: Account summary, Recent transactions, Budget, Bills and upcoming payments
  • Secondary: Transfer, Net wealth, Spending categories, Cash flow

Wealth

Jane

  • Primary: Net wealth, Account summary, Budget, Bills and upcoming payments
  • Secondary: Cash flow, Spending categories
  • Hidden: Transfer, Recent transactions

Customers choose once, with a live preview, and can change it later.

Personalise your banking

Grounded before blue sky

Blue-sky ideas like savings goals mostly didn't survive the budget or timeline, but they gave the team a direction and showed what the first release should skip.

Testing

Nine rounds, 532 participants

Each round tested one question, so a failure pointed at one decision.

Usability testing, rounds 1 to 9

The widgets customers came for got easier to use

98%task success on the final dashboard, with 87 participants

  • 93% liked their card beside the account details.40 of 43, round 9, account summary.

  • 95% called a quick dashboard transfer essential.38 of 40, round 5.

  • 88% preferred a list of upcoming bills to a calendar.35 of 40, round 2.

  • 87% found "Yesterday" and "Sunday" clearer than a date.33 of 38, round 5.

  • 100% found "Last log in" helpful for spotting misuse.40 of 40, round 1.

QIn their words

I know Netflix is every month. I don't need to know how it fits in my calendar. All I want to know is how many days until I need to pay it.

Round 2, bills

I love being able to go in, do a quick payment to my mate, and leave.

Round 5, transfer

I would not know when the 2nd of September was, but if you said yesterday I would.

Round 5, transactions

What testing changed

What did not work, and what changed

  • Net wealth as the headline.A big home loan showed as a big negative at every sign-in, so it now leads only for wealth customers.

  • Cash flow periods behind a settings icon.Almost nobody found them, so they became Week, Fortnight, Month and Year tabs.

  • A feedback widget as a score.People would only rate a bad experience, so we kept it as a signal, not a measure.

Delivery

Sized, sequenced and signed off

The tech lead, product owner, OneUI and accessibility signed off each widget. I then sized them with the squad and sequenced them by impact against effort.

Widget Impact Effort Release
New layout and Last log in High Low 1
Account summary High Low 1
Recent transactions High Medium 1
Transfer High High 2
Budgets Medium Medium 2
Bills and upcoming payments Medium Medium 2
Net wealth Medium Low 2
Cash flow and spending Low Medium 3

We set targets before the build, so the A/B test had something to be judged against.

Targets, set before the build

Ease of use

Up 20%, from 6.3 to 7.5 out of 10.

Targets, set before the build

eBanking NPS

Up 5%, from 44.0 to 46.2.

Targets, set before the build

Time to pay

Down 15%.

Targets, set before the build

Task success

Up from 85%.

The same priorities on mobile

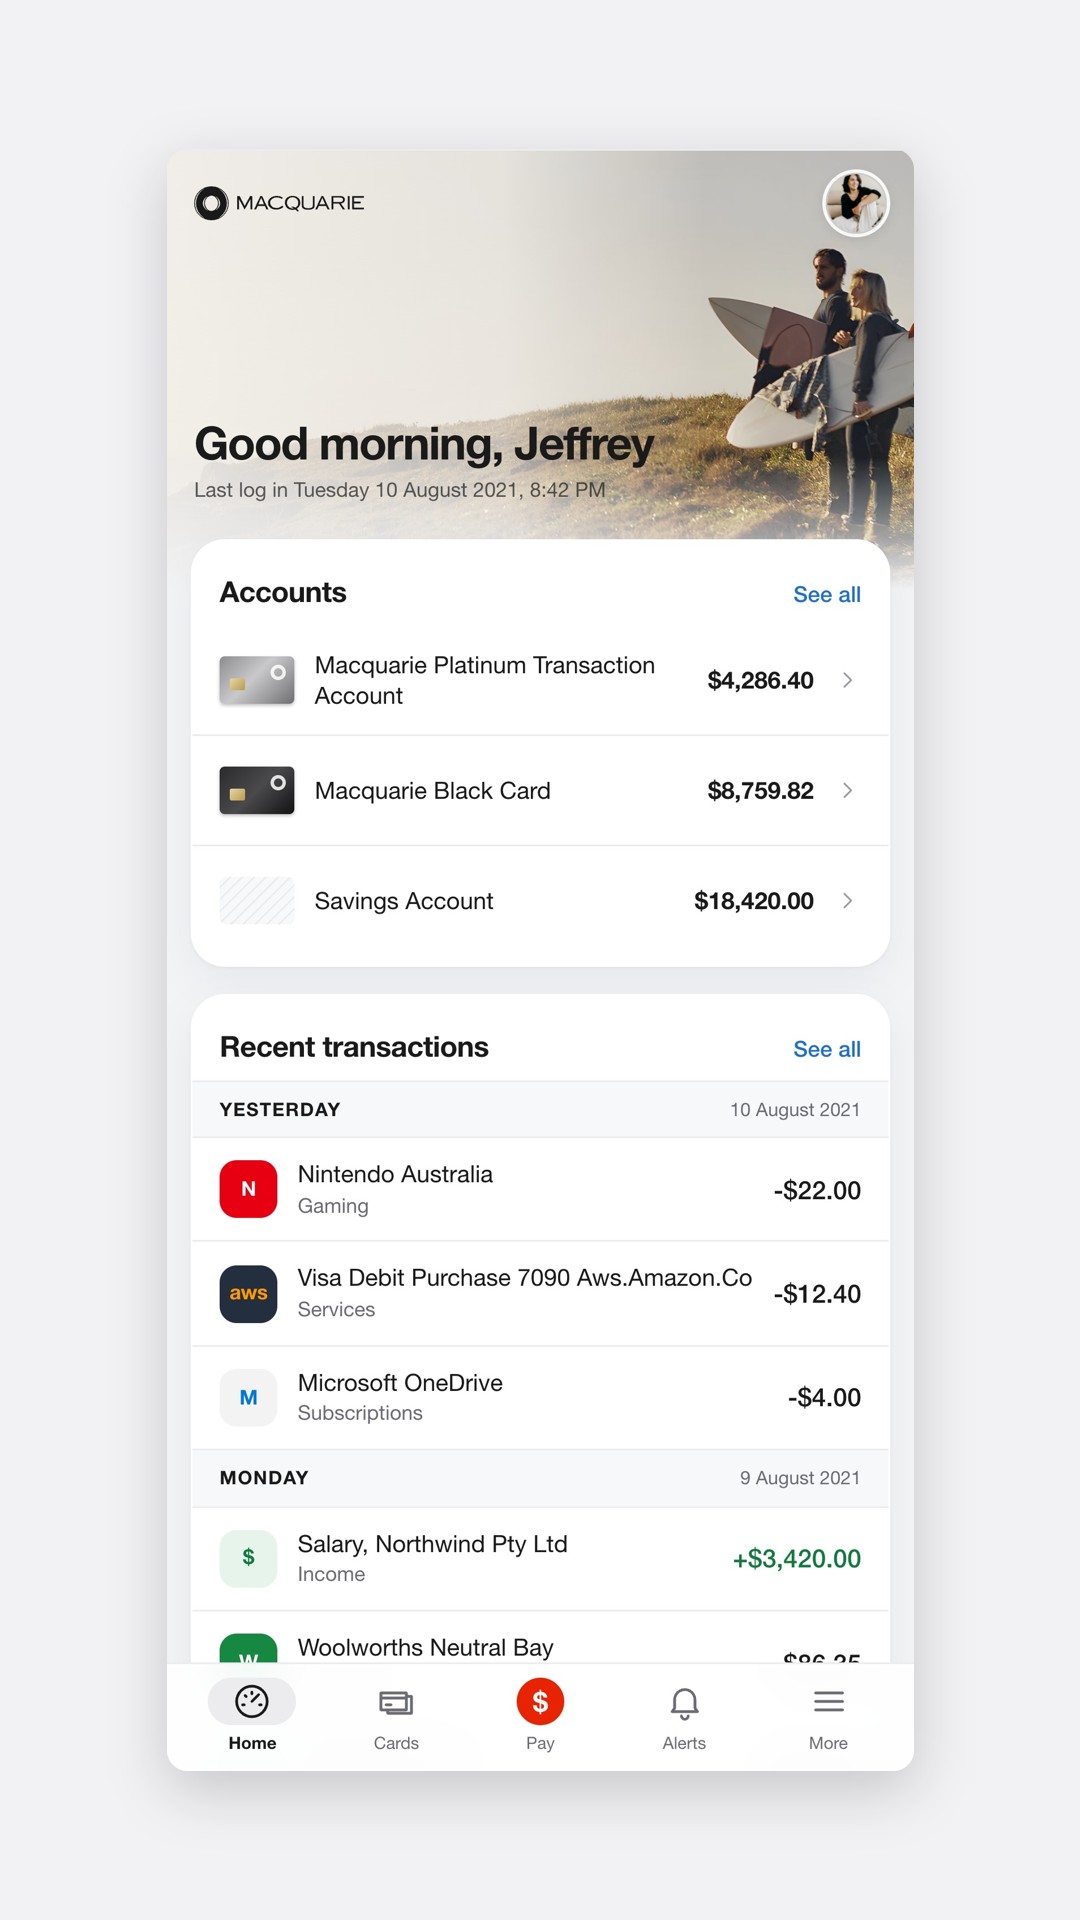
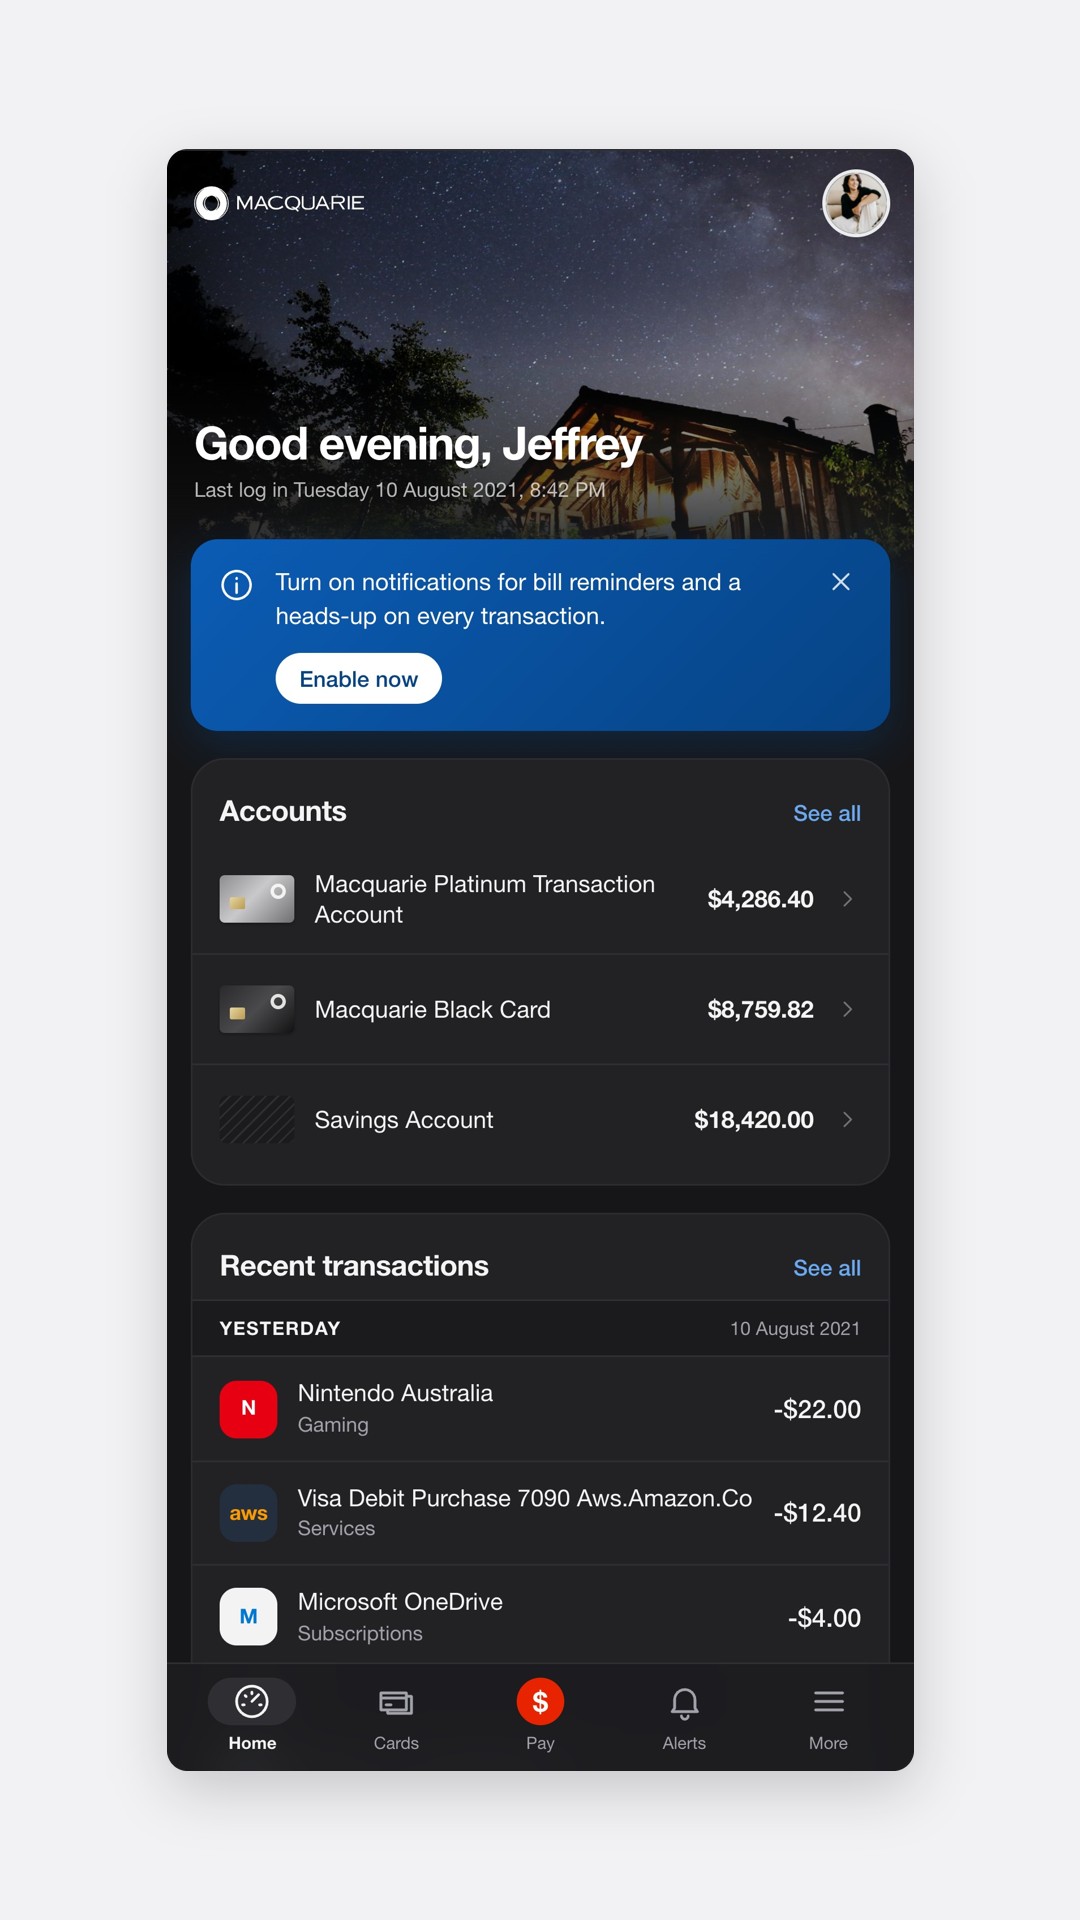
On mobile the order carried over, with the secondary column stacked below and collapsed.

Light

The redesigned dashboard in the mobile app, account summary at the top

Dark

The mobile dashboard in dark mode

Accessibility

Accessible by default, not by audit

The dashboard was built to WCAG 2.1 AA. I annotated the designs, reviewed the code for semantics and focus order, and tested with screen readers, keyboard and zoom on desktop, iOS and Android before each release.

I was also the principal accessibility consultant across Macquarie's business units, including vendor products: Macquarie.com and Macquarie.com.au, Personal Banking, Advisory, Business Bank, Property Management and the Broker Portal.

The system underneath

OneUI

When I joined, two sprint teams had already built plenty of duplicate UI, and an audit made the case for a design system. I then built components ahead of the sprints that needed them, so engineering never waited on design.

7

Products built on OneUI

90%+

Of UI design output covered by the system

The dashboard gave OneUI some of its most reused patterns: the account row, the collapsible card, the day-grouped transaction list and the inline transfer form.

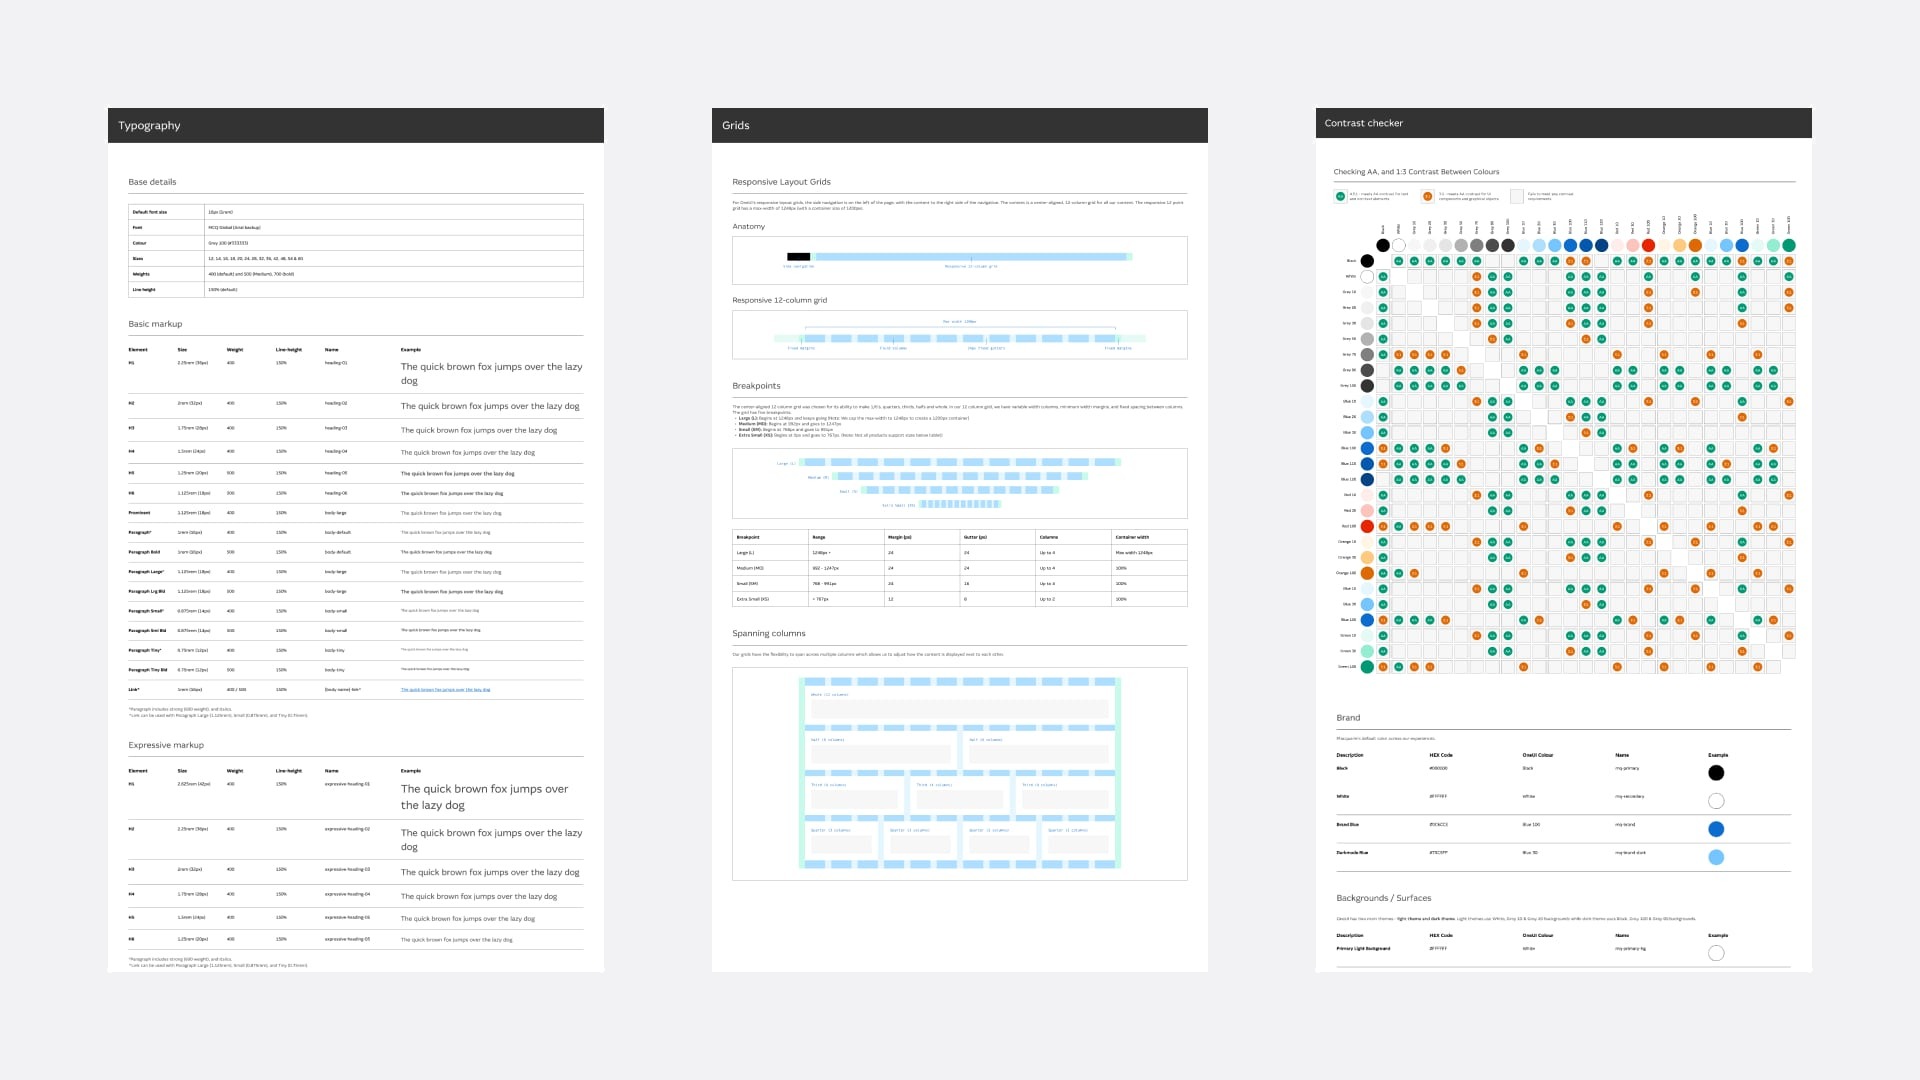
OneUI documentation pages for colour, form controls and tables
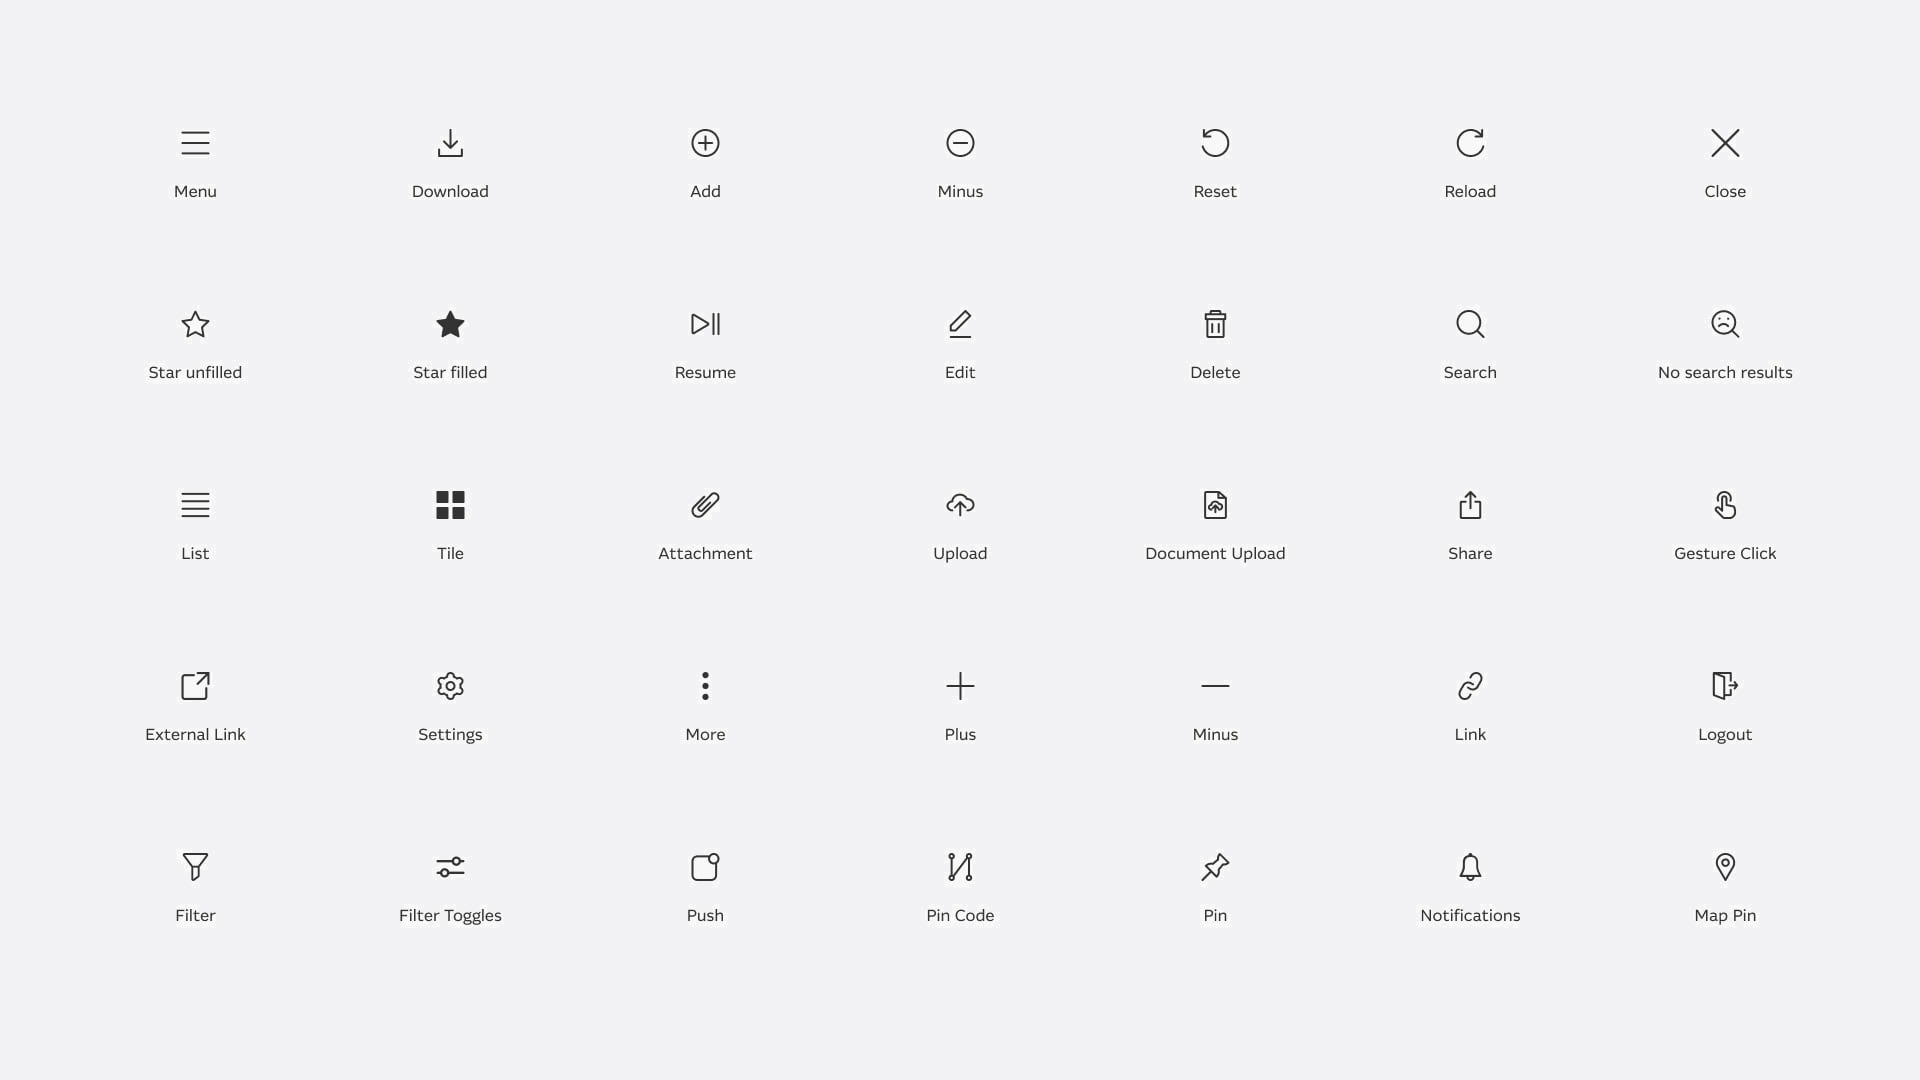
The OneUI icon set
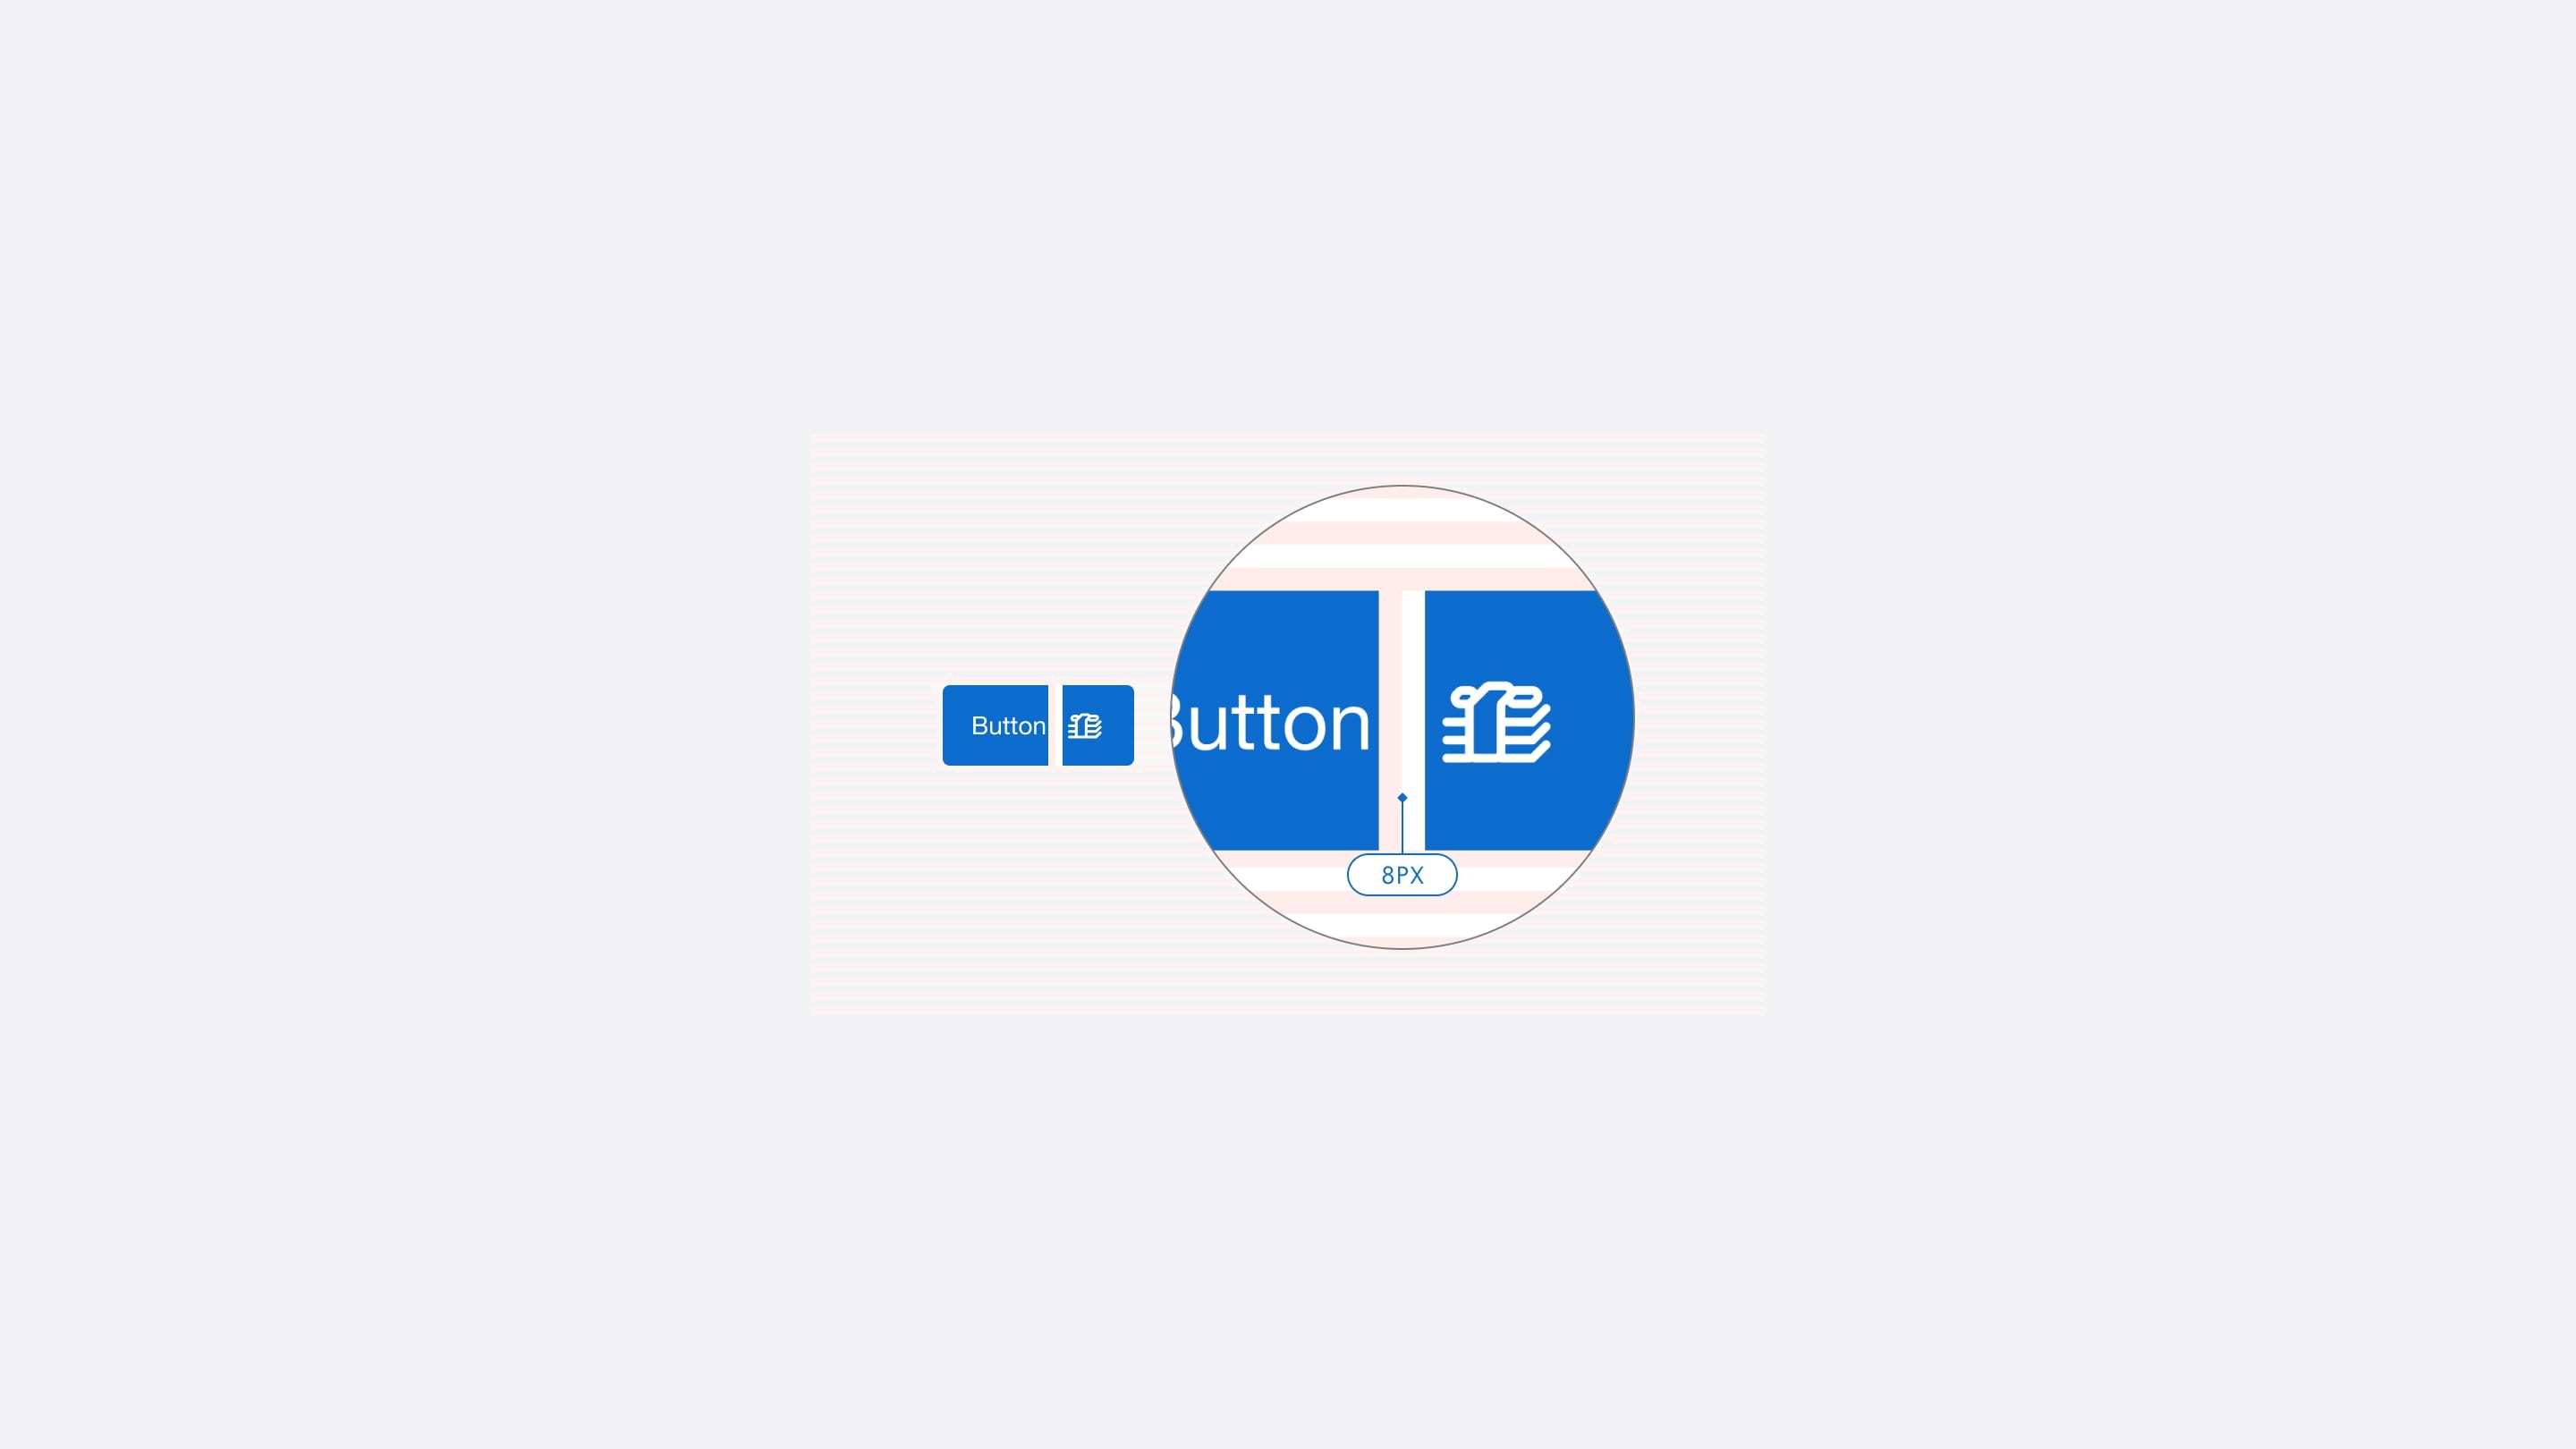
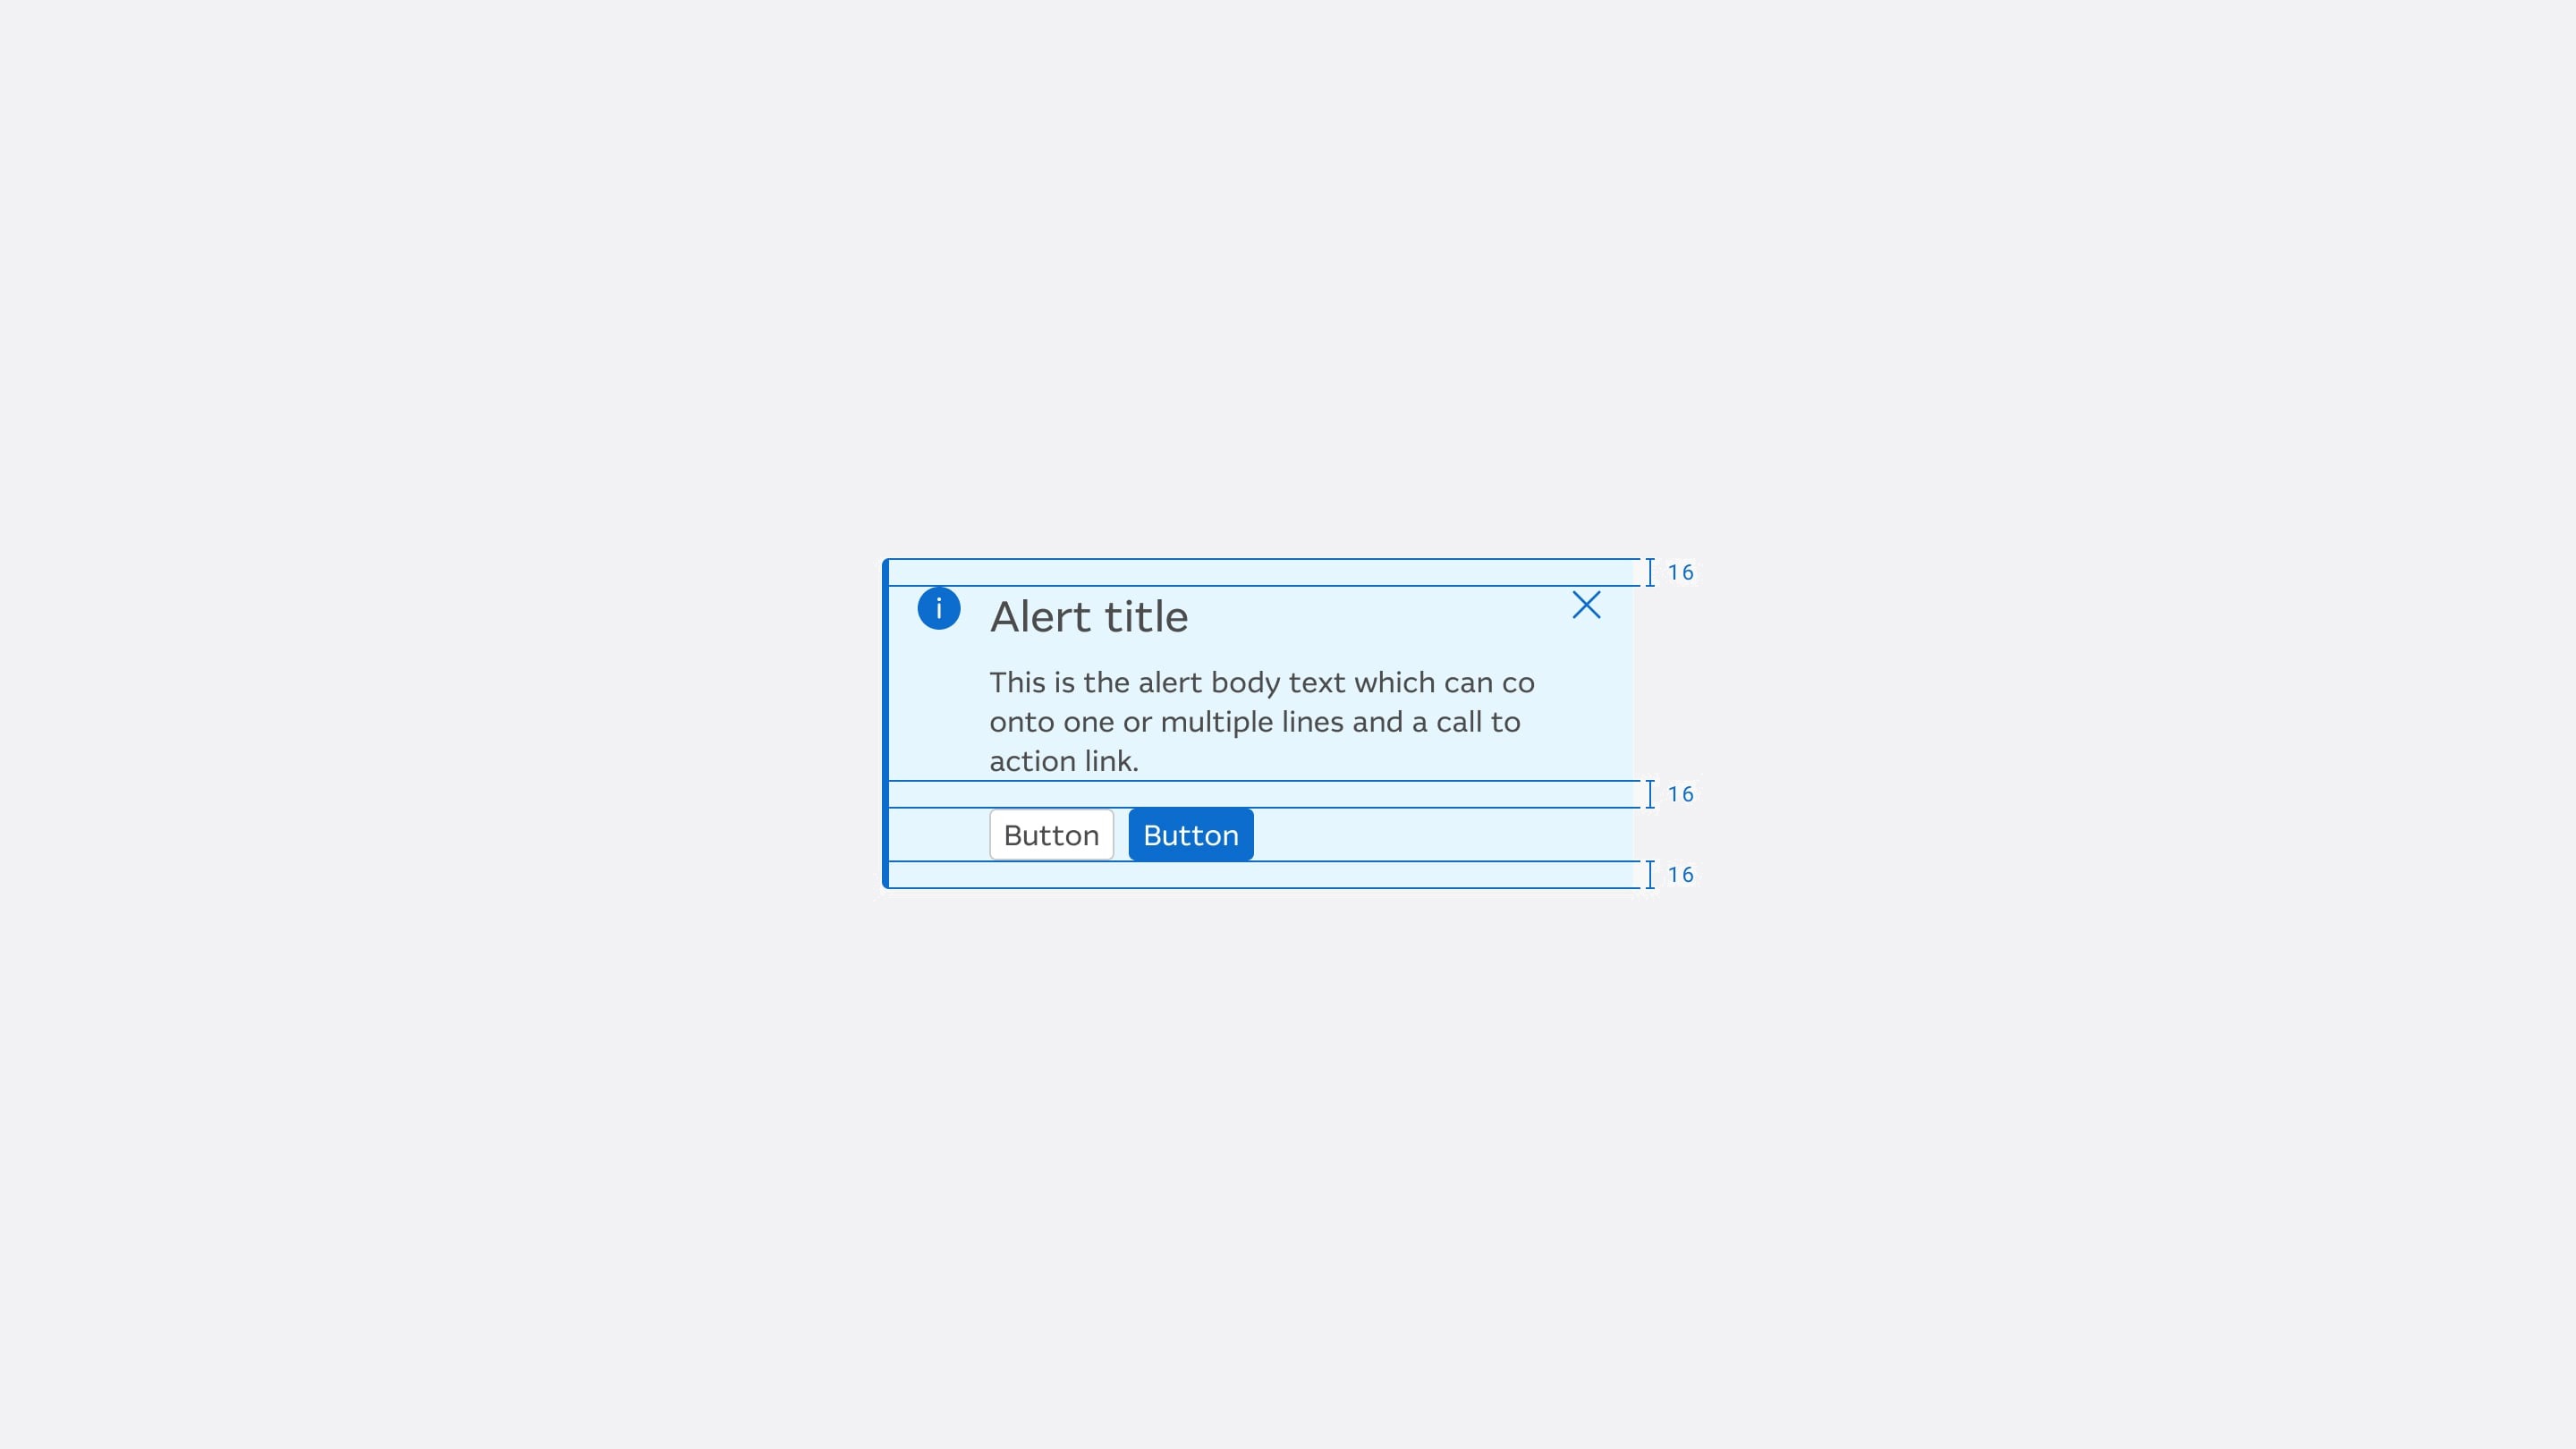
OneUI buttons in every variant and state, including the keyboard focus ringA OneUI alert, designed to be announced by screen readers

Then, search

Global search, from the same first screen

Next came search: every section had its own, and none could find a payment by name. We bet that one search for everything would cut frustration and calls to CX&O.

Redesigning global search

  1. 3 productsPersonal banking, wealth and business
  2. 350+ data pointsFrom Google Analytics and Medallia
  3. 40+ conceptsTested with 300+ participants

We tested real tasks, like paying a friend $10 for dinner. Results are grouped by type, with filters, without leaving the dashboard.

Global search

The impact

Measured against the targets we set

In a Google Optimize A/B test with 1,831 customers, the new dashboard beat every target.

Measure Target Result
Ease of use 6.3 → 7.5 6.3 → 8.9, up 41%
eBanking NPS 44.0 → 46.2 44.0 → 68.2
Time to make a payment Down 15% Down 23%
Task success Above 85% 98%
+41%

Ease of use, from 6.3 to 8.9 out of 10

−23%

Time to make a payment

25

Designers on the team by the end

It became the reference point for later Personal Banking design.

Your amazing positive energy that you bring to every meeting and every interaction. It's a delight to work with you. There was nothing that I have personally asked you to do and you haven't been able to do it. You always go above and beyond.

Depy KyristiHead of User Experience, Macquarie

Reflection

What I would do differently

I would say plainly which evidence backs which decision. The ranking stood on 55 responses and 13.9 million events; the card sort on three people.

I would also ship the strongest default first, since we never measured how many customers changed theirs, and add a choice only where data showed a group poorly served.